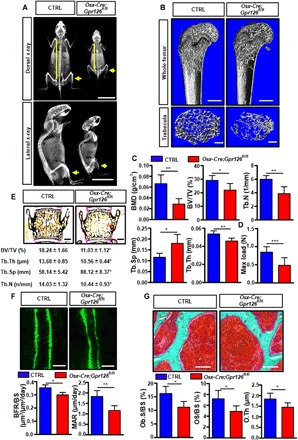
Fig. 2. Postnatal bone mass and bone strength were decreased in Osx-Cre;Gpr126fl/fl mice.

(A) Representative images of dorsal (top) and lateral (bottom) x-rays of 4-month-old mice (n = 3). Yellow lines indicate that the vertebral column was shorter in Osx-Cre;Gpr126fl/fl mice; yellow arrows indicate the decreased bone density in Osx-Cre;Gpr126fl/fl mice. Scale bars, 2 cm. (B) Representative μCT images of femurs from 1-month-old mice show the proximal femur (top; scale bars, 500 μm) and trabecular bone of the femur metaphysis (bottom; scale bars, 200 μm). (C) Quantitative μCT analysis of trabecular bone parameters of femurs from 1-month-old mice. BMD, bone mineral density; BV/TV, bone-volume/tissue-volume ratio; Tb.N, trabecular number; Tb.Sp, trabecular separation; Tb.Th, trabecular thickness. *P < 0.05, **P < 0.01, ***P < 0.001. n = 5. (D) Maximal loading (Max load) of humeral diaphysis from 1-month-old mice by three-point bending assay. n = 5. (E) Representative image of von Kossa staining of lumbar sections of 6-week-old mice (top) and trabecular bone parameters (bottom). Scale bars, 500 μm. n = 7. (F) Bone formation rate was decreased in Osx-Cre;Gpr126fl/fl mice. Representative images of calcein double labeling of the spinal trabecular bone of 6-week-old mice (top). Bone formation parameters from spinal sections of 6-week-old mice (bottom). BFR/BS, bone formation rate per bone surface; MAR, mineral apposition rate. Scale bars, 10 μm. *P < 0.05, **P < 0.01. n = 7. (G) Osteoid formation was suppressed in Osx-Cre;Gpr126fl/fl mice. Representative images of Goldner’s staining of 6-week-old mouse spinal trabecular bone. Spinal bone histomorphometric parameters. Ob.S/BS, osteoblast surface per bone surface; OS/BS, osteoid per bone surface; O.Th, osteoid thickness. Scale bars, 50 μm. *P < 0.05. n = 7.
