
Fig. 2. miRNA is selectively packaged into liquid-phase EV and MBV.
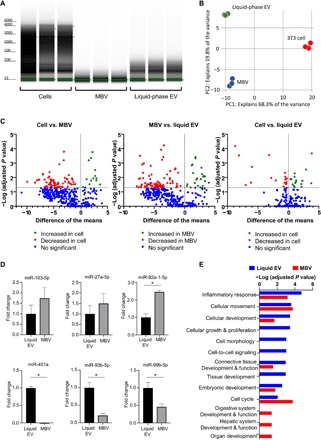
(A) Bioanalyzer analysis of total RNA isolated from 3T3 parental cells and their secreted liquid-phase EV and MBV. (B) Principal components analysis (PCA) comparing liquid-phase EV (green), MBV (blue), and cellular (red) RNA-seq datasets. (C) Volcano plot showing the differential expression of miRNAs in liquid-phase EV, MBV, and the parental cells. The inclusion criteria were a twofold difference of log2 (fold change) in either direction with a P value of <0.05. Each dot represents a specific miRNA transcript; green dots to the right of the vertical dashed line correspond to a relative increase in expression level, and red dots to the left correspond to a relative decrease in expression level. Blue dots indicate miRNA with no significant change in expression level. (D) RT-qPCR validation of the results of miRNA sequencing. *P < 0.05, n = 4. (E) IPA functional analysis. Significantly enriched molecular functions identified by IPA functional analysis considering differentially expressed miRNA in MBV (red) and liquid-phase EV (blue).