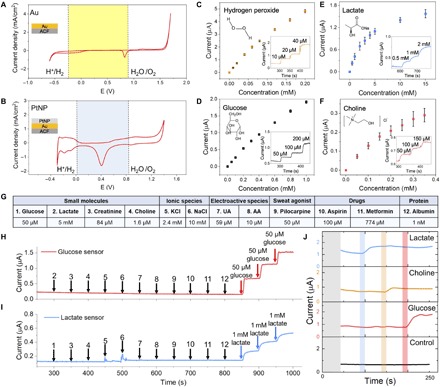
Fig. 3. FESS signal transduction characterization.

(A and B) Cyclic voltammetry characterization of Au (A) and Au/PtNP (B) electrode surfaces of the FESS, performed in 0.1 M H2SO4. Stable operational potential window (29) is highlighted with the shaded background. (C to F) FESS-based hydrogen peroxide (C), glucose (D), lactate (E), and choline (F) sensor responses to the target analytes (error bars indicate standard error, n = 3). Inset figures show representative amperometric responses. (G) Table of common interferents in biofluids (e.g., sweat). (H and I) Comprehensive selectivity studies for glucose (H) and lactate sensors (I) by monitoring the corresponding sensor responses to the sequential introduction of the listed interferents and target analytes (the introduction time points and the interferents/target analytes are indicated by arrows). (J) Characterization of a representative sensor array response built on the FESS platform for multiplex sensing. AA, arachidonic acid.
