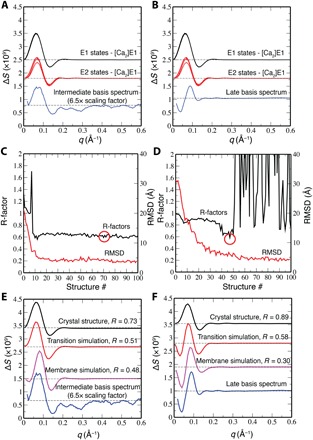
Fig. 3. Structural refinement of the intermediate and late basis spectra.

Comparison of TR-XSS (A) intermediate and (B) late basis spectra to difference scattering profiles generated from subtracting calculated scattering of a [Ca2]E1 crystal structure (PDB ID: 2C9M) from each of the considered E1 (PDB IDs: 3N8G, 1T5T, and 3BA6) and E2 (PDB IDs: 3B9B, 3N5K, 3FGO, and 3NAL) state crystal structures. Simulated transition dynamics from a [Ca2]E1 crystal structure (PDB ID: 2C9M) to the target state (C) [Ca2]E1ATP (PDB ID: 3N8G) or the target state (D) E2-P (PDB ID: 3N5K). Plotted is the RMSD (red) to each target structure and the corresponding R-factor (black) with respect to the (C) intermediate and (D) late basis spectra. Simulation frames corresponding to the lowest R-factors are encircled (red). Improvements in the best fits to the (E) intermediate (with a 6.5× scale factor relative to the late basis spectrum) and (F) late basis spectra are shown for difference profiles calculated from crystal structures (black), transition simulation (red), and membrane simulation (magenta).
