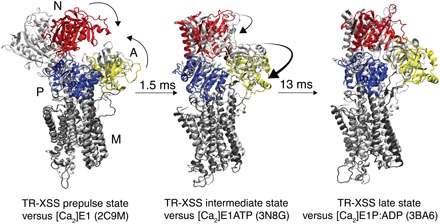
Fig. 4. The refined TR-XSS models of prepulse, intermediate, and late states (N, A, P, and M domains colored as in Fig. 1) are shown with the closest corresponding crystal structures (white) and formation rise times from the kinetic analysis.

All protein structures were superimposed on the M7–M10 helices.
