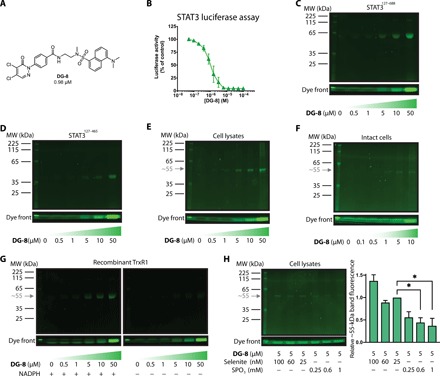
Fig. 2. DG-8, a fluorescent 4,5-dichloropyridazinone probe for target identification and specificity.

(A) The chemical structure of DG-8, which incorporates many characteristics of the top compounds from the SAR study. (B) STAT3-dependent luciferase assay data showing DG-8 is a potent inhibitor of STAT3-dependent transcription (IC50 = 0.98 μM). (C and D) DG-8 (0.5 to 50 μM) was incubated with 5 μg of two recombinant STAT3 protein truncations STAT3127–688 (C) and STAT3127–465 (D) for 30 min, then run on an SDS–polyacrylamide gel electrophoresis (SDS-PAGE) gel, and analyzed for dansyl fluorescence. The dye front is representative of the amount of DG-8 used in each sample. (E) DG-8 (0.5 to 50 μM) was incubated with A549 cell lysates for 30 min, and the protein content (30 μg) was analyzed by SDS-PAGE and dansyl fluorescence. A single fluorescent band was detected with a molecular weight (MW) of approximately 55 kDa (gray arrow). (F) DG-8 (0.1 to 10 μM) was incubated with A549 cells in culture for 30 min. Cells were then collected and lysed, and 30 μg of the resultant protein lysate was analyzed by SDS-PAGE and dansyl fluorescence. Again, a single fluorescent band was detected at approximately 55 kDa (gray arrow). (G) Recombinant TrxR1 protein (5 μg) was incubated with DG-8 (0.5 to 50 μM) in the presence or absence of NADPH (7.5 μg) as indicated. Following 30 min incubation, samples were analyzed by SDS-PAGE and dansyl fluorescence under reducing conditions. A ~55-kDa fluorescent band is detected only in the presence of NADPH, indicating that DG-8 reactivity with TrxR1 is dependent on NADPH, which is consistent with binding to the Sec residue of TrxR1 (23). (H) To assess whether the ~55-kDa band might be a Sec-containing protein, A549 cells were incubated for 72 hours with sodium selenite (25 to 100 nM) to promote Sec incorporation into cellular selenoproteins or SPO3 (0.25 to 1 mM) to induce Sec-to-Cys substitution (29). The cells were then lysed and treated with DG-8 (5 μM) for 30 min at room temperature. The resulting sample containing 30 μg of protein lysates was run on an SDS-PAGE gel (reducing conditions) and analyzed for dansyl fluorescence. Bands occurring at ~55 kDa were quantified and plotted as bar graphs (*P < 0.05, n = 2). Band intensities were normalized to the sample containing 25 nM selenite, as this was the concentration used throughout this work to ensure adequate selenium supplementation.
