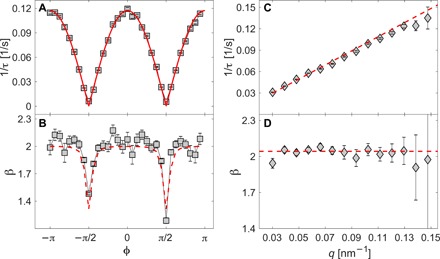
Fig. 2. The dynamics is ballistic and the velocity field lies in the scattering plane.

(A) Relaxation rates corresponding to q = (12.0 ± 0.3) × 10−2nm−1 as a function of the azimuthal angle, ϕ, with 0 corresponding to the horizontal position, see inset of Fig. 1A. The red line corresponds to ∣qδv cos(ϕ)∣, where δv = (0.97 ± 0.03)nm/s is deduced from a fitting procedure. (B) Compression exponent, β, of the relaxation function corresponding to the same q value as for (A). The marked decrease in the shape parameter in the vertical direction is an artifact due to the finite ϕ-resolution (here δϕ = π/16), i.e., the vertical sectors see a larger distribution of relaxation times as τ → ∞ for ϕ → ± π/2, and the resulting autocorrelation functions are stretched, as it can be seen from the blue data in Fig. 1B. The red dashed line is obtained from a simple numerical model where a function of the kind exp [−2(q δv t cos (ϕ))2]is integrated over the experimental q resolution. The average value of β in the horizontal sectors is 〈β(ϕ)〉ϕ = 2.05 ± 0.05. (C) Relaxation rate, 1/τ, evaluated for the intensity autocorrelation functions corresponding to the horizontal direction and as a function of q. The red line is a linear fit of 1/τ = ∣q · δv∣, and the obtained value δv = (0.99 ± 0.02)nm/s is consistent with that obtained in (A). (D) Compression exponent evaluated for the same data as in (C) and as a function of q. The red dashed line is the weighted average, which corresponds to β = 2.04 ± 0.02.
