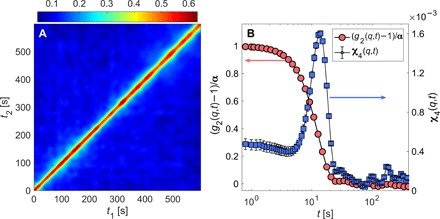
Fig. 3. Evidence of dynamical heterogeneities.

(A) Two-times autocorrelation matrix computed at the peak, qmax = (6.4 ± 0.3) × 10−2 nm−1, of the structure factor S(q) and obtained selecting only the horizontal sectors within the range Δϕ = ± π/4. Large fluctuations are clearly visible, being a typical sign of heterogeneous dynamics. (B) χ4(q, t) (blue squares, right y axis) together with the corresponding normalized intensity autocorrelation function (red circles, left y axis). These data correspond to the same q value as in (A). The χ4(q, t) has been computed using the extrapolation scheme described in (21).
