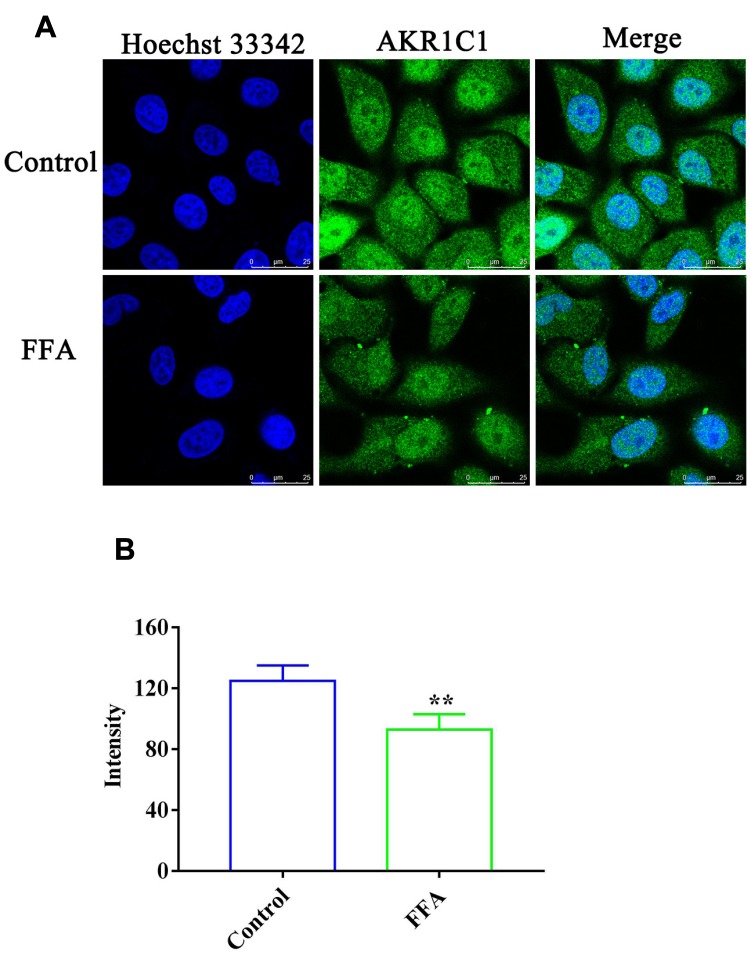
Figure 4.
The expression of AKR1C1 in the HepG2 cells. (A) Confocal microscopy images of HepG2 cells incubated with or without FFA for 24 h. Green fluorescence denotes AKR1C1 and blue fluorescence denotes nuclei staining; (B) The fluorescence intensity in the HepG2 cells with or without FFA treatment. **p < 0.01 vs control treatment cells.

