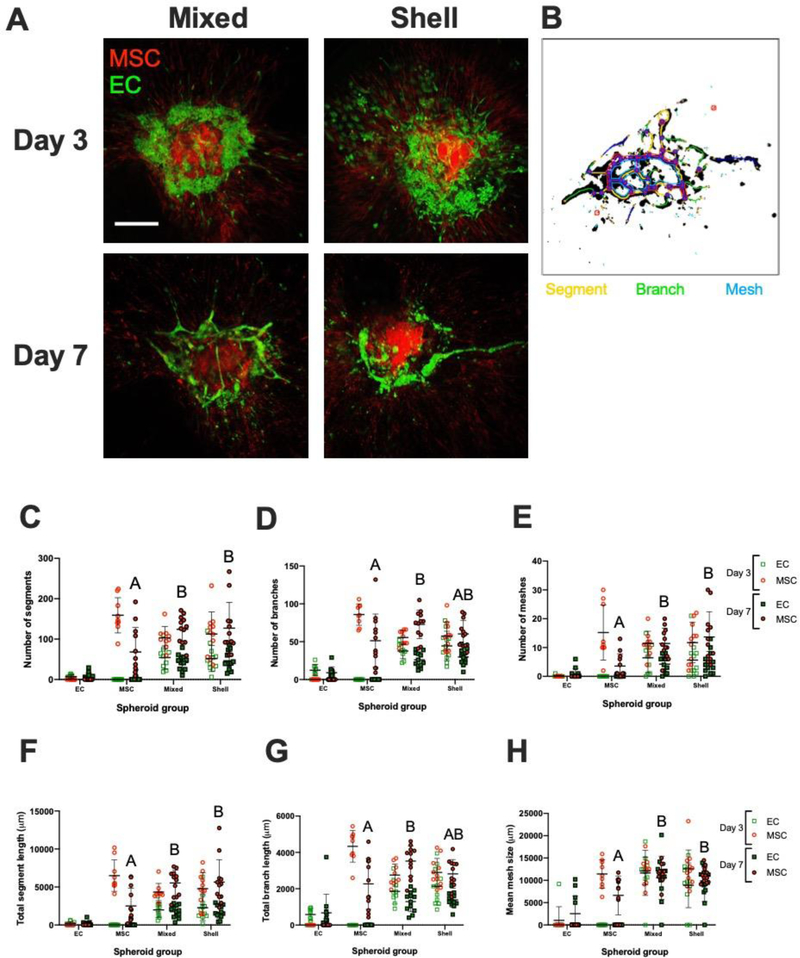
Figure 3. EC-MSC sprouting patterns in fibrin gel on Day 3 and Day 7.
(A) Confocal images of EC-MSC mixed and shell spheroids in fibrin gel on Days 3 and 7. ECs are green; MSCs are red. Scale bar = 250 μm. (B) Representative overlay of spheroid with quantification metrics to visualize segments (yellow), branches (green), and meshes (blue). (C) Number of segments (D) number of branches, and (E) number of meshes in field of view on Day 3 and Day 7 separated by population channel for each spheroid group. (F) Total segment length (G) total branch length (H) and mean mesh size in field of view on Day 3 and Day 7 separated by population channel for each spheroid group. Chart values represent mean ± standard deviation (n=9–12); open markers denote Day 3 while filled markers refer to Day 7. Different letters denote statistical significance of MSC populations between groups.

