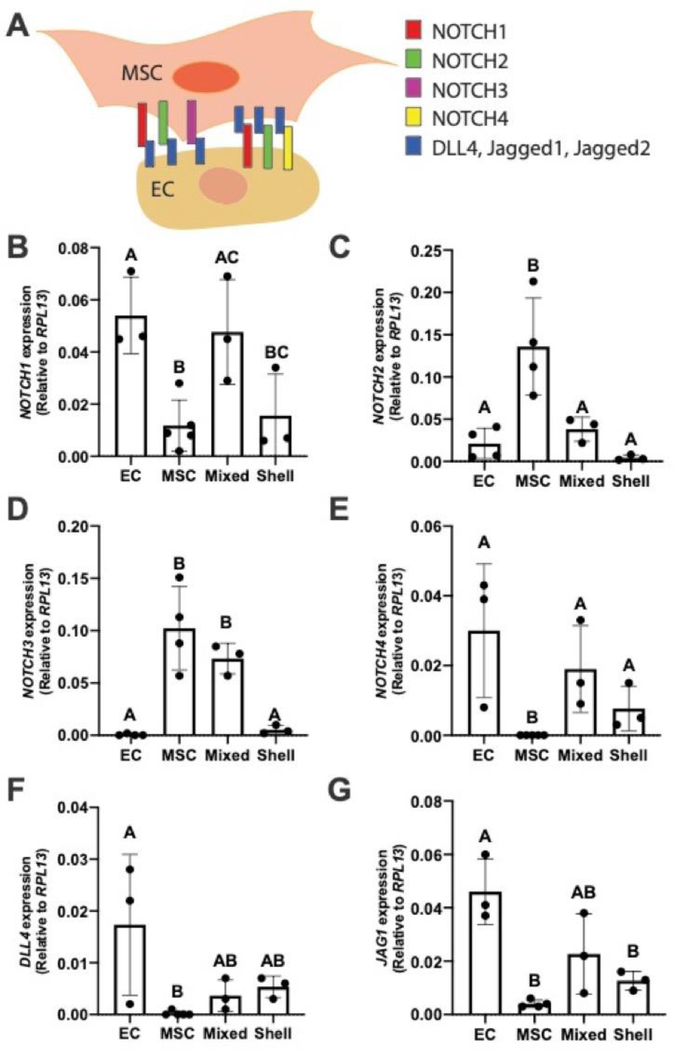
Figure 4. EC localization influences NOTCH signaling in EC-MSC co-culture spheroids.
(A) Illustration of NOTCH expression of MSC and ECs with respective ligands. (B) NOTCH1 (C) NOTCH2 (D) NOTCH3 (E) NOTCH4 (F) DLL4 (E) and JAG1 expression. Chart values represent mean ± standard deviation (n=3–5). Different letters denote statistical significance between groups.

