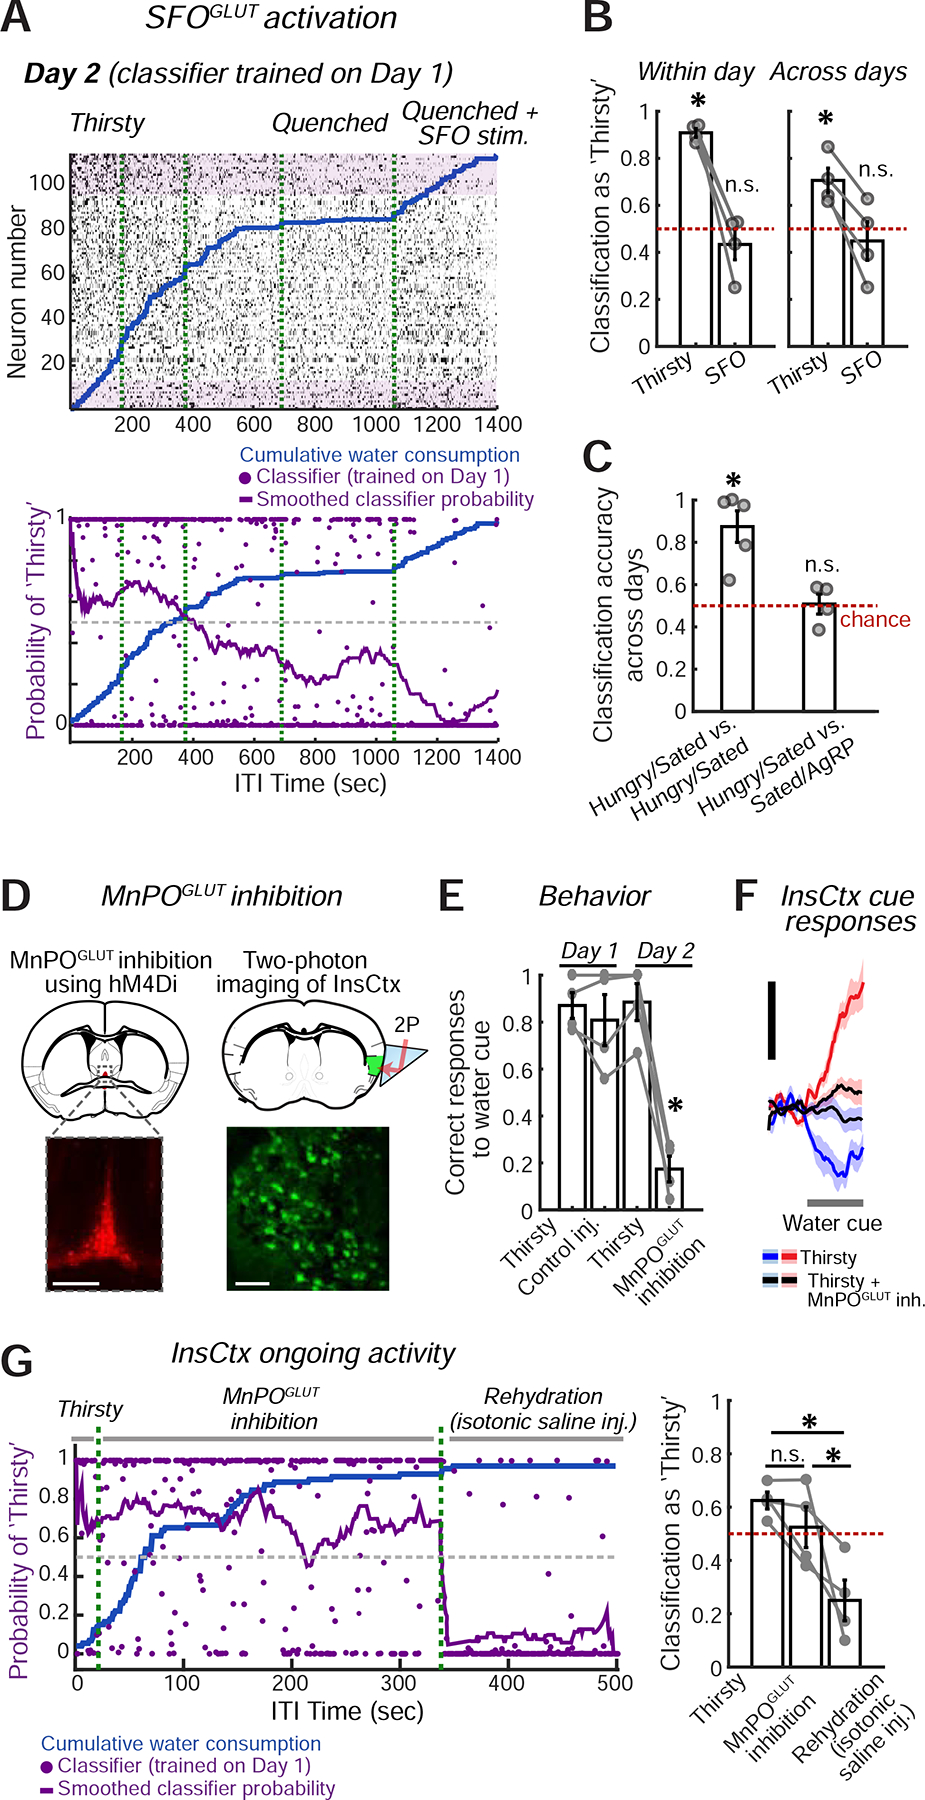
Figure 6: Manipulations of Hypothalamic Hunger and Thirst Neurons Do Not Affect InsCtx Ongoing Activity.

A. Top: example ongoing activity of an InsCtx population on the second day of the experiment. Bottom: classification of all time points. Classifier was trained on the previous day’s ongoing activity. Green dashed lines: separation between consecutive 30 min imaging sessions.
B. Summary of classification of ongoing activity during ‘Thirsty’ and ‘Quenched+SFOGLUT activation’ across mice. *p≤0.014; ns: not significant, p≥0.38; t-test vs. chance (n=4 mice).
C. Summary of classification of ongoing activity during ‘Hungry’ and ‘Sated+AgRP activation’ across mice. ‘Hungry/Sated vs. Hungry/Sated’: classifier trained on Hungry vs. Sated on Day 1 and tested on Hungry vs. Sated on Day 2. ‘Hungry/Sated vs. Sated/AgRP’: classifier trained on Hungry vs. Sated on Day 1 and tested on Sated vs. ‘Sated+AgRP activation’ on Day 2. *p≤0.007; n.s.: not significant, p≥0.87, t-test vs. chance (n=4 mice).
D. Experimental approach for chemogenetic inhibition of MnPOGLUT neurons (top left), while imaging InsCtx (top right). Bottom left: image of MnPO showing hM4Di-mCherry expression. Scale bar: 200 μm. Bottom right: two-photon image of InsCtx during MnPOGLUT inhibition. Scale bar: 100 μm.
E. Summary of behavior across mice (n=4). Correct water cue responses across conditions: p=6.6×10⁻⁵ (one-way ANOVA), MnPOGLUT inhibition vs. all other conditions: *p<0.0005 (paired t-test). All other comparisons were not significant. All tests include Holm-Bonferroni correction for multiple comparisons.
F. Average population responses of all imaged neurons to the water cue during the different conditions. Scale bars: 0.5 normalized ΔF/F (z-score across states, within day).
G. Ongoing activity across ‘Thirsty’, ‘Thirsty + MnPOGLUT inh.’, and ‘Rehydration’ conditions. Left: classification of all time points. Classifier was trained on the previous day’s ongoing activity. Green dashed lines separate consecutive 15 or 30 min imaging sessions. Right: summary of classification of ongoing activity across conditions. ‘Thirsty’ vs. ‘Thirsty + MnPOGLUT inh.’: p=0.08; ‘Thirsty’ vs. ‘Rehydration’: p=0.015; ‘Thirsty + MnPOGLUT inh.’ vs. ‘Rehydration’: p=0.04 (paired t-test). All tests include Holm-Bonferroni correction for multiple comparisons (n=4 mice). Values are mean±s.e.m. across mice.
