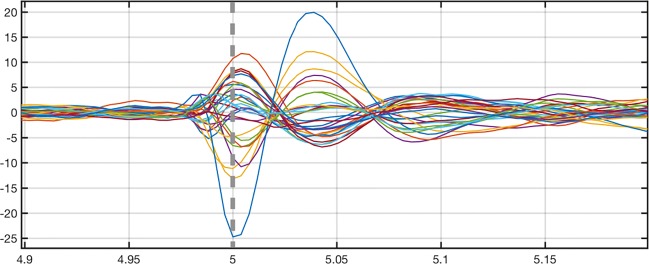
Fig. 4.
A butterfly plot of EEG inversion test (Section “EEG Inversion Test”) data which were obtained by averaging 58 epileptiform discharges between -5 and 5 s. The vertical axis shows the measured voltage in microvolts, and the horizontal axis the measurement time in seconds. The reconstruction was found for the zero time point 0 s which is indicated by the vertical dashed line

