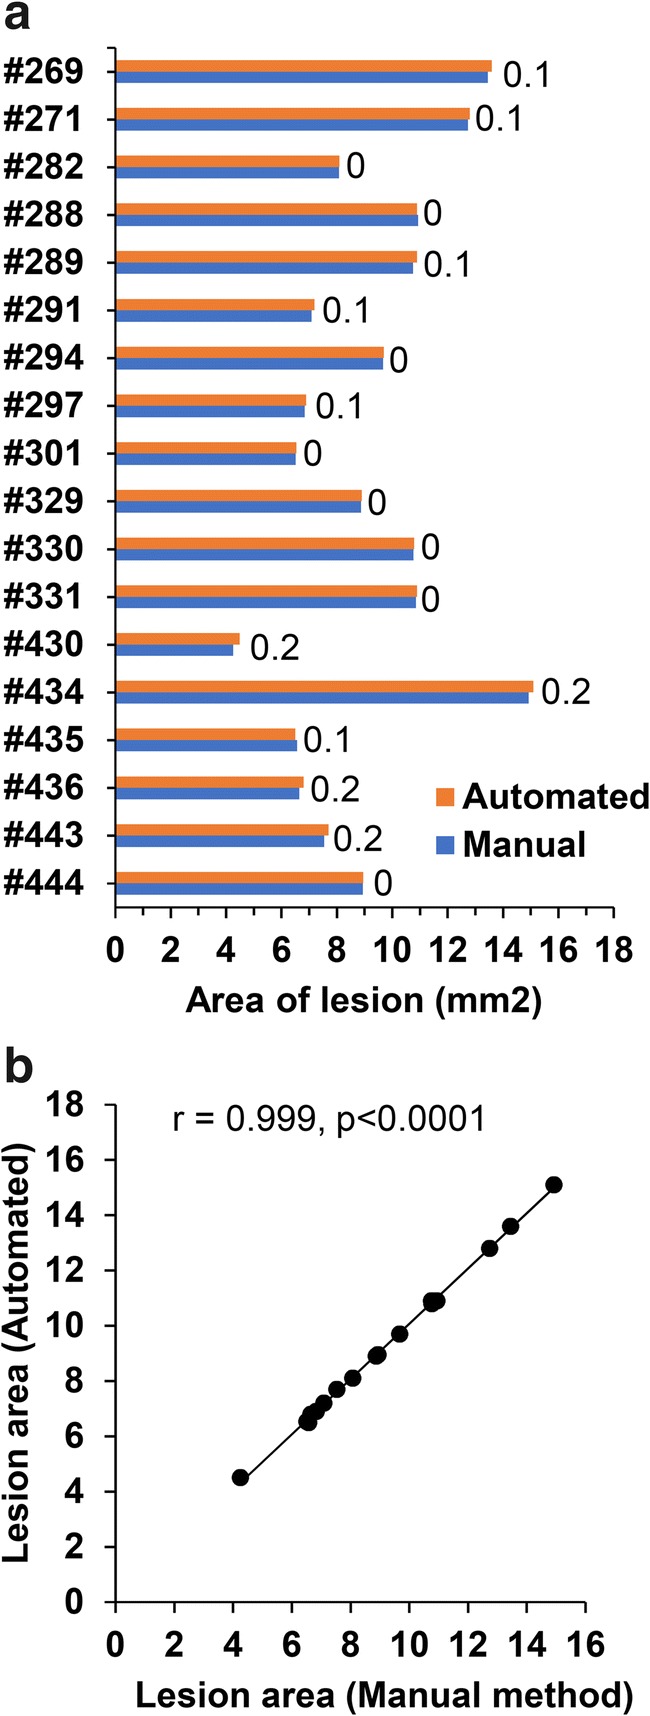
Fig. 6.

Bar graph and scatter plot of the lesion area generated manually and by Web application (automated method). (a) Bar graph showing the area of the cortical lesion estimated from the unfolded map generated by the manual method and the Web application method (automated). Numbers in the graph indicate the difference in the lesion area between methods. Note the minimal difference between the two methods (b) Scatter plot showing the correlation between the manual and automated methods (Pearson correlation)
