Fig. 1.
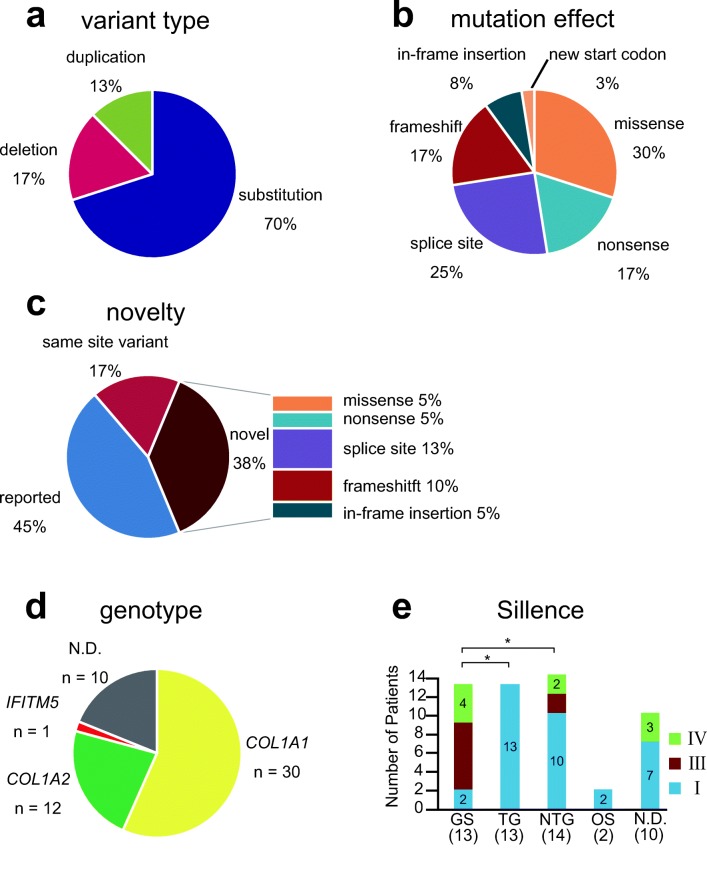
Mutation spectrum. a Frequency of disease-causing variants according to variant type. b Frequency of disease-causing variants according to mutation effect. c Frequency of novel disease-causing variants according to mutation effect. “Reported” includes variants that are completely matched with the reported one. “Same site variant” represents variants in which other base changes at the same site have been reported. d Frequency of disease-causing variants according to affected genes. e Frequency of OI according to the Sillence classification for each mutation type on COL1A1 and COL1A2. N.D., not detected; GS, glycine substitution group; TG, truncating group; NTG, non-truncating group; OS, other missense group

