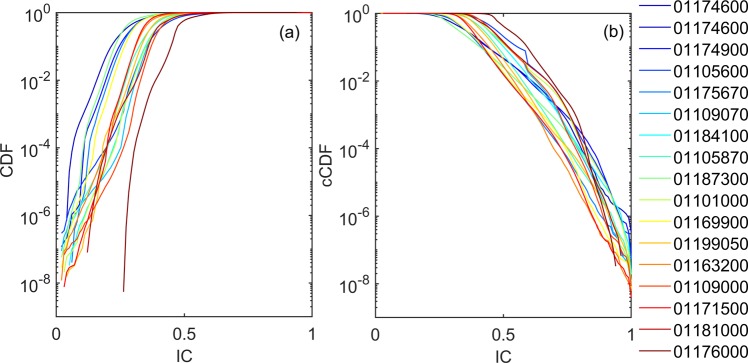
Figure 4.
Cumulative (CDF, (a) and complementary cumulative distribution (cCDF, b) function for the connectivity index (IC), obtained for each watershed (colour-coded according to the watersheds drainage area, from blue to red for increasing values). Within each watershed large portions of the landscape tend to present low values of connectivity (a), while generally smaller extents show comparable high connectivity (b). Clusters of disconnected (a) or connected (b) landscapes can be seen [decreasing slope in the CDF or cCDF, where the gradient increases again later], highlighting the existence of diverse (across watersheds) but consistent (within watersheds) morphodynamics units, acting as sinks or source of sediments.

