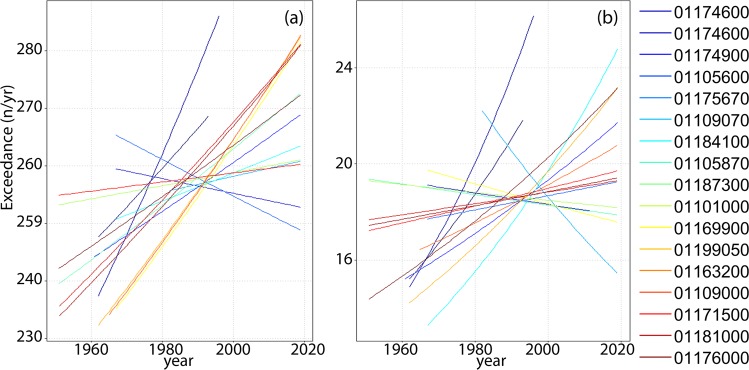
Figure 6.
Flow frequency mean-unbiased exponential trend (in units of exceedance of Q30 (a) and Q95 (b), n/yr) versus year obtained for each watershed (colour-coded according to the watersheds drainage area, from blue to red for increasing values). The slope of each curve identifies increasing (positive) or decreasing (negative) trends during the years. These curves demonstrate that nonstationarity in flood frequency is common. Trends in exceedance of low (a) and extreme flows (b) are widespread across scales and landscape units, challenging existing paradigms of flood frequency analysis and channel design.

