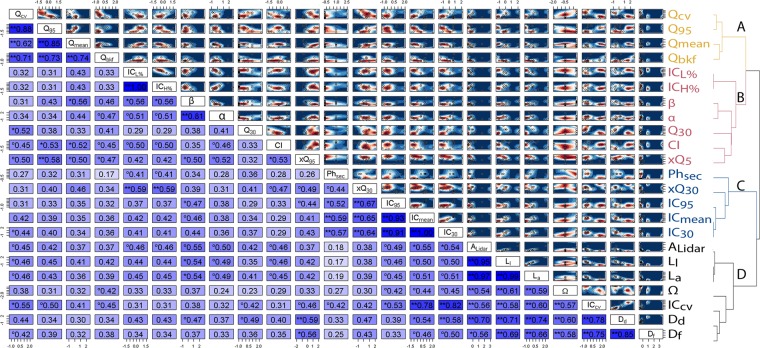
Figure 7.
Atmospheric (CI), landscape (IC, Phsec), river (α,β) and flow (Q, xQ) properties are correlated to different degrees (values of correlation -dCor- close to 0 represent no correlation, and 1 represent perfect correlation) [Lower triangular matrix in the image; shades of blue highlights the correlation strength, from weak (light) to strong (dark)], with some strong non-linear dependence emerging between specific variables [dCor values marked with ** are statistically significant at the 0.05 level, values marked with * are significant at the 0.1 level, values marked with ° are significant at the 0.2 level.] The interaction between variables [open circles in the upper triangular matrix] reinforces or offsets the decadal trends of exceedance of extreme flows [upper triangular matrix; shades of red represent progressively increasing decadal trend, white represent no trend, and shades of blue represent decreasing trends]. We used a kernel density estimation (KDE138,) to display in a non-parametric way the decadal trend for each 2 way combination of landscape indicators, using the start positions of each variable within the scatterplot. The correlation strength allows to define cluster of variables (dendrogram) that are more closely related. Elements that are merged at a lower height (shorter branches in Fig. 7) are more similar (dependent) than Elements that merge at greater height. It is possible to identify four separate clusters, including flow properties (A), reach properties, climate and flood hazard (B), morphodynamics properties (C), and scale-dependent parameters (D). Figure was arranged using customized scripts on Rstudio Version 1.2.1335. See Data and software availability for details.

