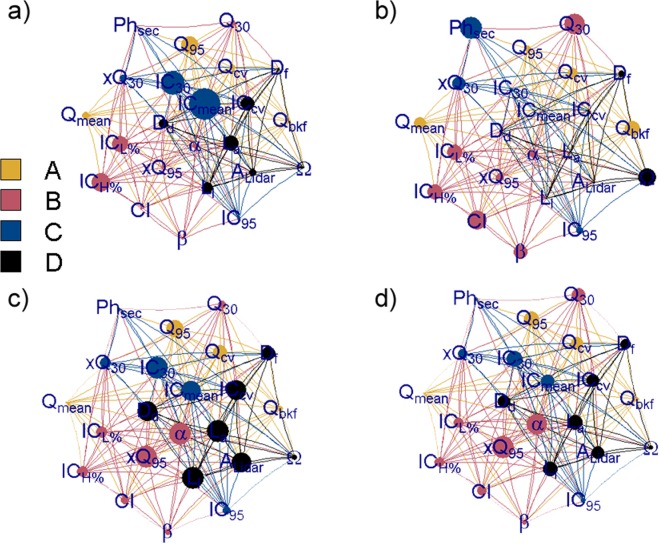
Figure 8.
Components of the various clusters (Flow properties (A), reach properties, climate and flood hazard (B), morphodynamics properties (C) and scale-dependent parameters (D)) assume different roles within the network depending on the centrality measure considered [larger importance is highlighted by symbols with sizes proportional to the centrality measure: betweenness (a), closeness (b), degree (c), and strength (d)]. Mean connectivity and rate of dis-connectivity (ICmean, IC30 in a) have more control over the network, because more information pass through these nodes (highest betweenness). Physiographic properties, low-flows and climate (Phsec, Q30, CI in b) have more direct influence on other vertices (lowest closeness). The rate of channel adjustment, decadal trend in extreme flows and the rate of disconnectivity (slope of the HSF β, xQ95 and IC30 in (c)) are connected to lots of nodes at the heart of the network (highest degree), however the decadal trend in extreme flows (xQ95, d) is the node with the higher level of correlation (highest strength). Figure was arranged using customized scripts on Rstudio Version 1.2.1335. See Data and software availability for details.

