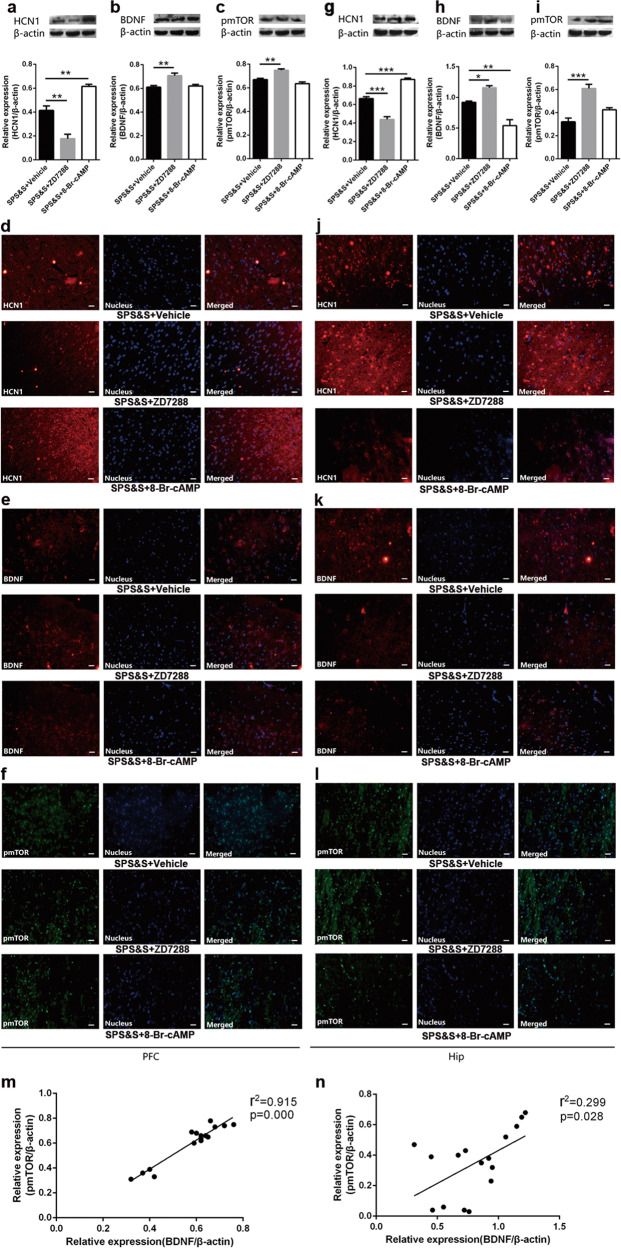
Fig. 4. Effects of ZD7288 and 8-Br-cAMP on the expression of relative protein in the PFC and Hip under SPS&S procedure normalized by β-actin.
a–c The expression of HCN1 (one-way ANOVA: F(2, 9) = 46.185, p = 0.000; Post-hoc test: SPS&S + ZD7288: p = 0.001, SPS&S + 8-Br-cAMP: p = 0.003), BDNF (one-way ANOVA: F(2, 9) = 10.446, p = 0.005; Post-hoc test: SPS&S + ZD7288: p = 0.005, SPS&S + 8-Br-cAMP: p = 0.885) and pmTOR (one-way ANOVA: F(2, 9) = 23.233, p = 0.000; Post-hoc test: SPS&S + ZD7288: p = 0.002, SPS&S + 8-Br-cAMP: p = 0.135) in PFC. g–i The expression of HCN1 (one-way ANOVA: F(2, 9) = 91.914, p = 0.000; Post-hoc test: SPS&S + ZD7288: p = 0.000, SPS&S + 8-Br-cAMP: p = 0.000), BDNF(one-way ANOVA: F(2, 9) = 26.364, p = 0.000; Post-hoc test: SPS&S + ZD7288: p = 0.039, SPS&S + 8-Br-cAMP: p = 0.003) and pmTOR(one-way ANOVA: F(2, 9) = 24.342, p = 0.000; Post-hoc test: SPS&S + ZD7288: p = 0.000, SPS&S + 8-Br-cAMP: p = 0.063) in Hip. d–f, j–l Localization and distribution of HCN1, BDNF and pmTOR in PFC (d–f) and (j–l). Bar = 20 μm. m, n The correlation between the level of BDNF and pmTOR in the PFC (m) and Hip (n) analyzed with linear regression. Data are represented as mean ± SEM. *p < 0.05 was expressed statistically significant. *p < 0.05, **p < 0.01, and ***p < 0.001 compared with SPS&S + Vehicle group. The mediator effect test of BDNF (bootstrap) with a sample size of 5000 and 95% confidence interval showed that the BDNF was a mediator between HCN1 and pmTOR in the PFC (model: XpmTOR = 0.0104×HCN1 + 0.9152×BDNF, confidence interval: [−0.7259, −0.0211], effect: −0.3802) and Hip (model: XpmTOR = 0.7760×HCN1 + 0.7211×BDNF, confidence interval: [0.4280,1.1241], effect: 0.3186).

