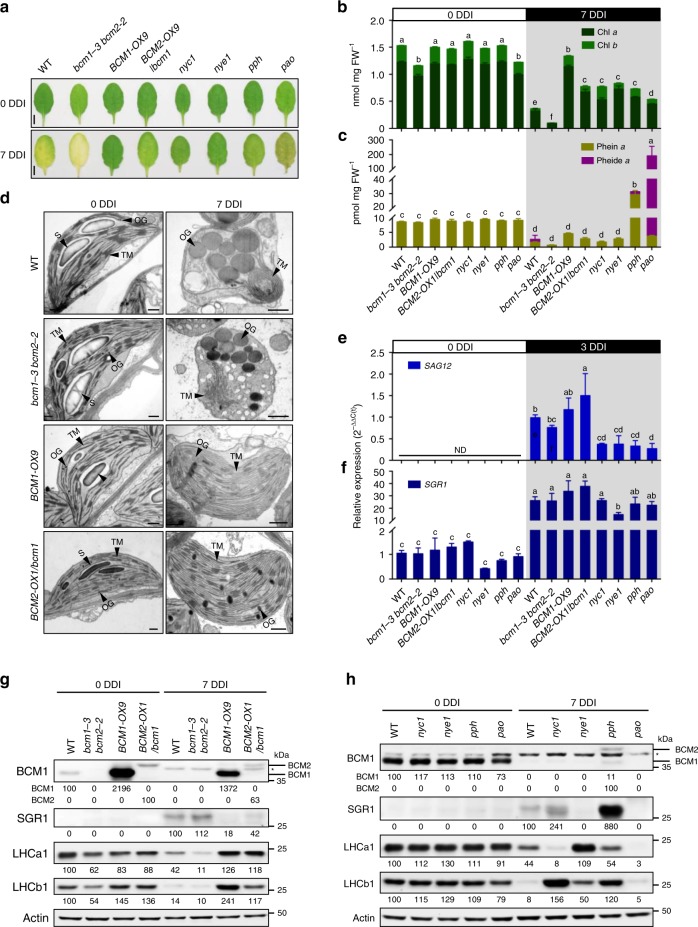
Fig. 6. Both BCMs act as negative regulators of Chl catabolism.
a Representative images of detached leaves from 35-day-old Arabidopsis plants grown under short-day normal light (120 μmol photons m−2 s−1) conditions prior to (0 DDI) and after 7 days of dark incubation (7 DDI). Scale bars, 0.5 cm. b, c Levels of Chl (b) and Chl catabolites (c) in the detached leaves shown in a at 0 and 7 DDI. d Transmission electron micrographs showing chloroplast structures at 0 and 7 DDI. OG, osmiophilic plastoglobuli; S, starch granule; TM, thylakoid membrane. Scale bars, 0.5 µm. e, f qRT-PCR analysis of SAG12 (g) and SGR1 (h) transcripts in the detached leaves from 21-day-old Arabidopsis plants grown under short-day normal light (120 μmol photons m−2 s−1) conditions at 0 and 3 DDI. Expression levels of SGR1 and SAG12 are presented relative to those in the WT seedlings at 0 and 3 DDI, respectively. ND, not detected. g, h Steady-state levels of the indicated proteins in detached leaves from various Arabidopsis seedlings in a at 0 and 7 DDI were detected by immunoblotting using the indicated antibodies. Immunoblot analyses of Actin were used as a loading control. Numbers below the immunoblots represent normalized protein abundances relative to WT seedlings at 0 DDI. Asterisks indicate nonspecific signals on the immunoblots. In b, c, e, f, error bars represent SD of three biological replicates. Letters above histograms indicate significant differences determined by Tukey’s HSD method (P < 0.05).

