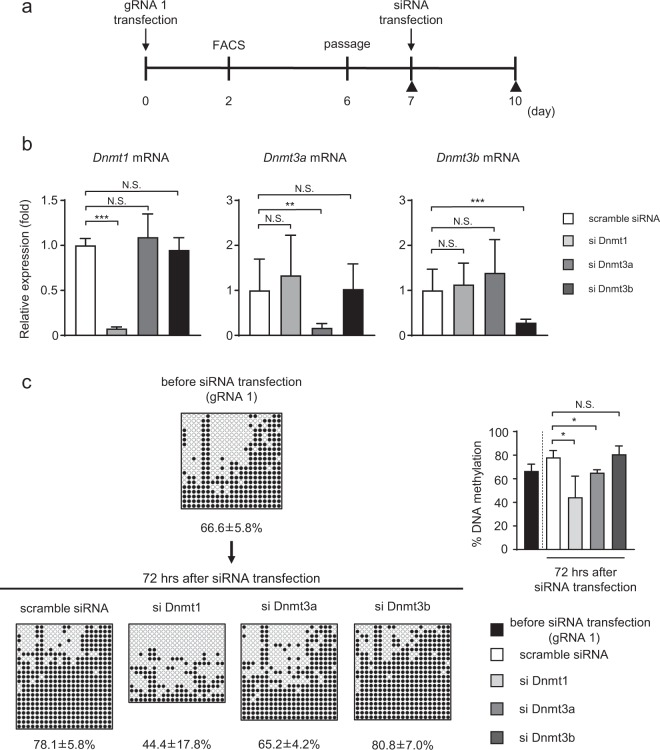
Figure 3.
Transfection of Dnmts siRNA. (a) Experimental protocol of the transient transfection system with gRNA1 and Dnmts siRNA. Closed triangles indicate BS analysis. (b) Gene expression levels of Dnmts 72 h after transfection with scramble or Dnmts siRNA in Hepa1-6 cells. Statistical analyses were performed using the Mann–Whitney U-test. Data are expressed as mean ± SD. n = 7–9 per group. **P < 0.01; ***P < 0.001; N.S., not significant vs. scramble siRNA. (c) (Left panel) BS analysis of the Fgf21 promoter at the designated time points. Representative data of four independent experiments are shown. %DNA methylation is indicated below as mean ± SD. (Right panel) Graphic presentation of statistical analysis of the BS data (n = 4 at each time point). Statistical analyses were performed using the Mann–Whitney U-test. Data are expressed as mean ± SD. *P < 0.05; N.S., not significant vs. scramble siRNA.

