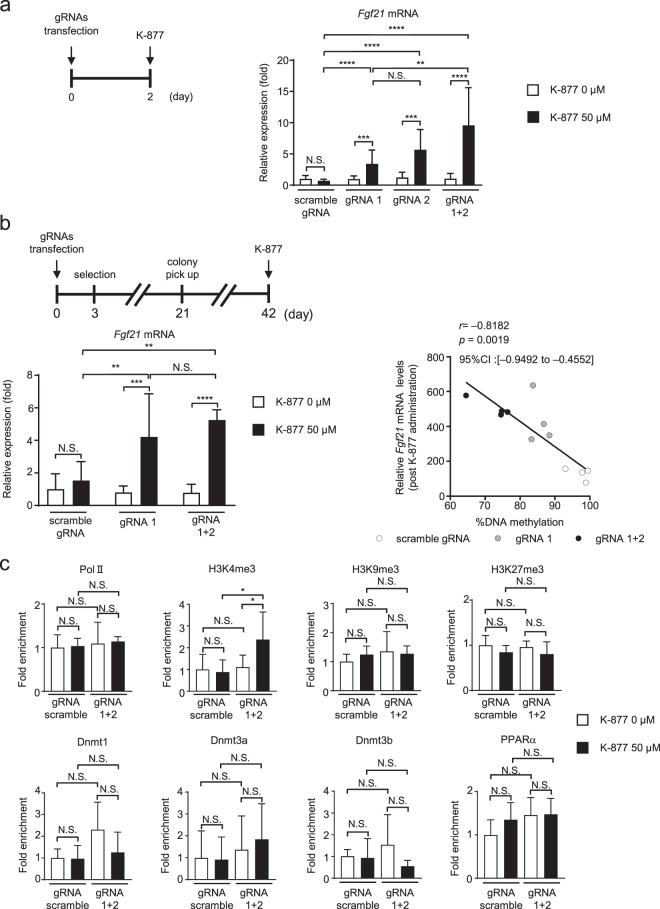
Figure 5.
Fgf21 mRNA expression in Hepa1-6 cells with targeted DNA demethylation of the Fgf21 promoter induced using the dCas9-SunTag and scFv-TET1CD system. (a) Experimental protocol of the transient transfection system with gRNAs (scramble gRNA, gRNA1, gRNA2, and gRNA1+2) and administration of SPPARMα, K-877 (left panel). Fgf21 mRNA expression levels after the administration of K-877 (right panel). n = 7–9 per group. (b) Experimental protocol of the stable transfection system with scramble gRNA, gRNA 1, and gRNA 1+2 and administration of K-877 (upper panel). Fgf21 mRNA expression levels after the administration of K-877 (lower left panel). n = 6–7 per group. Correlation between Fgf21 mRNA levels post K-877 administration and %DNA methylation (n = 12) (lower right panel). Statistical analyses were performed using Spearman’s rank correlation coefficient. CI: Confidence interval. (c) ChIP assays of Pol II, histone markers, Dnmts, and PPARα. Primers amplifying the regions −106 to +21 (for Pol II, histone markers, and Dnmts) and of −977 to −923 bp (for PPARα) were used for ChIP-qPCR analysis (Fig. 1b). n = 5–6 per group. Statistical analyses were performed using the Mann–Whitney U-test. Data are expressed as mean ± SD. *P < 0.05, **P < 0.01; ***P < 0.001; ****P < 0.0001; N.S., not significant between the denoted pairs.

