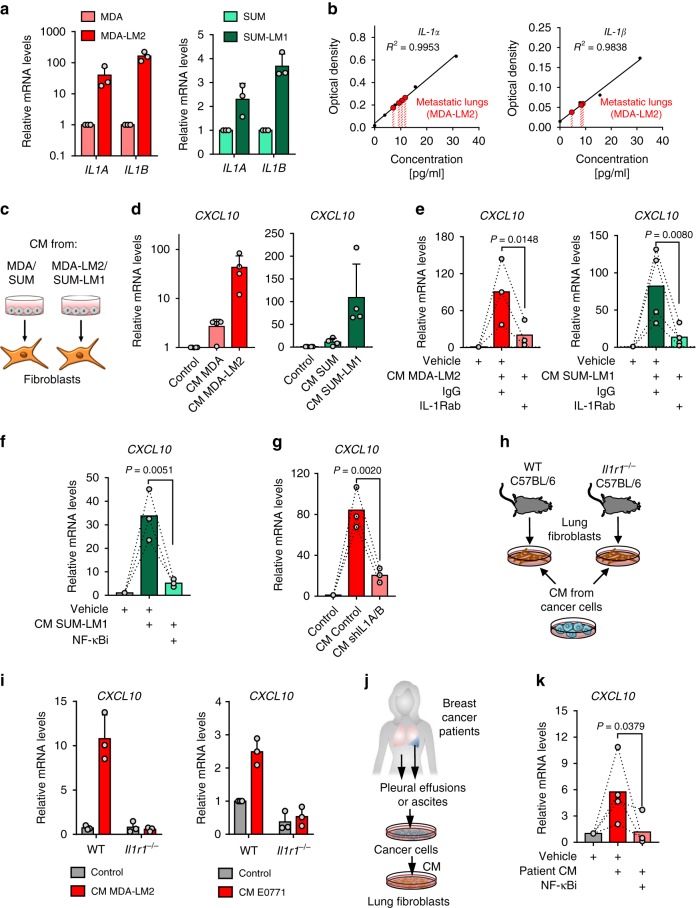
Fig. 5. Metastatic breast cancer cells express IL-1α/β to directly induce CXCL9/10 in reactive fibroblasts.
a IL1A and IL1B expression in MDA and SUM parental breast cancer cells and their metastatic derivatives MDA-LM2 and SUM-LM1 analyzed by RT-qPCR; n = 3. b Human IL-1α and IL-1β protein levels in the lungs from xenograft mouse models after intravenous injection of MDA-LM2 cancer cells measured by ELISA. Shown are standard curves and interpolated IL-1α and IL-1β concentrations in lung lysates from four mice (IL-1α) and 3 mice (IL-1β). Analyzed samples were diluted 1:2. c Schematic of setup for experiments using cancer cell conditioned medium (CM) to stimulate fibroblasts. d CXCL10 expression in MRC-5 fibroblasts treated with CM from MDA/SUM cells or MDA-LM2/SUM-LM1 for 48 h; n = 4 experiments. CXCL10 expression in MRC-5 fibroblasts treated with MDA-LM2 or SUM-LM1 cancer cell CM alone or co-treated with 20 µg/ml IL-1R1 blocking antibody (IL-1Rab) or isotype control (IgG) (e), or 5 µM JSH-23 (NF-κBi) or vehicle (f) for 48 h. MDA-LM2; n = 3; SUM-LM1, n = 4 (e) and n = 3 (f). g CXCL10 expression in fibroblasts treated with CM from control or IL1A/B knockdown (shIL1A/B) MDA-LM2 cancer cells for 48 h; n = 3 experiments. h Schematic of setup where fibroblasts isolated from lungs of wild type (WT) and IL-1 receptor deficient (Il1r1−/− C57BL/6) mice were treated with CM from MDA-LM2 or E0771 cells or control medium. i CXCL10 mRNA levels determined by RT-qPCR in CM-treated WT or Il1r1−/− fibroblasts as in h; n = 3 experiments. a, d, i Data points depict expression in biological replicates, bars show mean with SD. j Schematic setup where lung fibroblasts were treated with CM from primary cancer cells derived from pleural effusions or ascites of metastatic breast cancer patients, alone or in combination with 5 µM JSH-23 (NF-κBi) for 48 h. k CXCL10 mRNA levels determined by RT-qPCR in lung fibroblasts as in (j). CM from n = 4 different patient-derived cancer cell samples were used. e–g, k The linked set of values are relative expression in independent experiments. Bars depict mean. P values in were determined by ratio-paired one-tailed t-tests.

