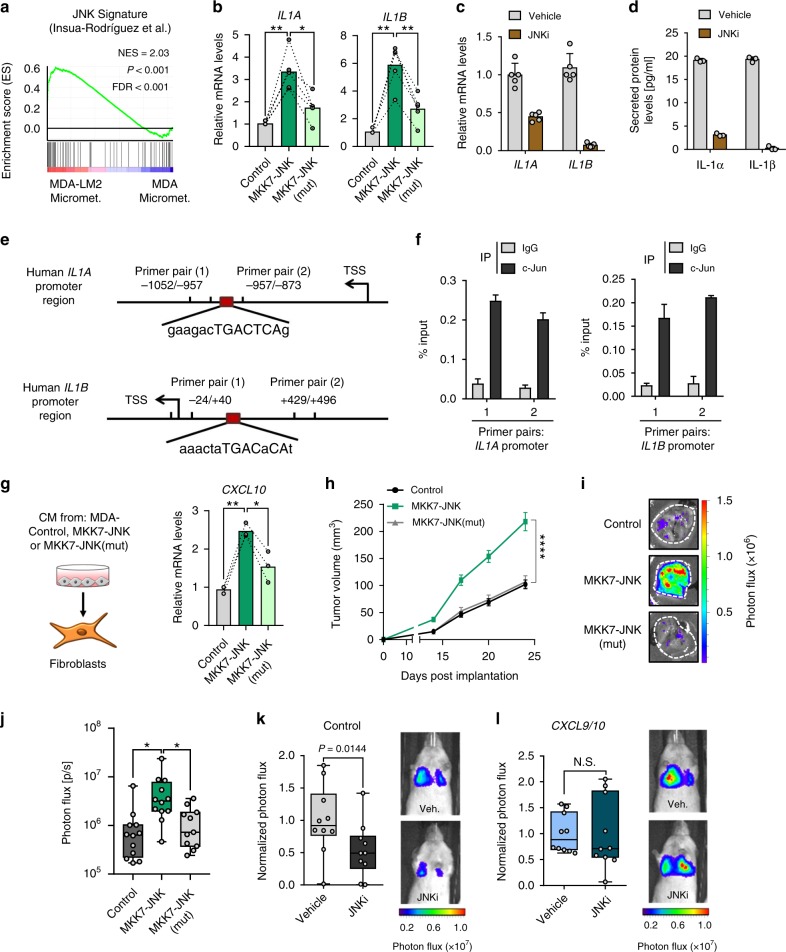
Fig. 7. JNK signaling in breast cancer cells induces IL1A/B.
a Enrichment of JNK signature18 in MDA-LM2 cells compared with parental MDA cells, isolated from lung micrometastases. NES normalized enrichment score, FDR false discovery rate. P value was determined by random permutation test. b IL1A and IL1B mRNA levels in MDA cells transduced with activated JNK (MKK7-JNK), a mutated version of JNK (MKK7-JNK(mut)), or vector control, determined by RT-qPCR. n = 5. IL1A/B mRNA (c) and protein (d) levels in MDA-LM2 cells or MDA-LM2 conditioned medium (CM) respectively, after treatment with 5 µM CC-401 JNK inhibitor (JNKi) or DMSO (vehicle) for 48 h. Data points depict expression in biological replicates, bars show mean with SD; n = 5 (mRNA), n = 3 (protein). e Maps of IL1A and IL1B promoter regions showing c-Jun consensus binding sites and primer positions for ChIP-qPCR. TSS transcription start site. f ChIP-qPCR analysis of IL1A and IL1B promoter chromatin bound to c-Jun in MDA-LM2 cells. Bars depict mean with SD. g CXCL10 expression in MRC-5 fibroblasts treated with CM from MDA cells expressing MKK7-JNK, MKK7-JNK(mut), or control vector; n = 3. b, g Linked sets of values show expression in independent experiments and bars depict mean. P values were calculated by repeated measures one-way ANOVA with Tukey’s multiple comparisons tests. * P < 0.05, ** P < 0.01. h Primary tumor growth upon injection of MDA-control, MKK7-JNK, or MKK7-JNK(mut) cells into mammary fat pads of NSG mice; n = 24 (control, MKK7-JNK) tumors from 12 mice per group and n = 22 (MKK7-JNK(mut)) tumors from 11 mice, from two independent experiments. Values are mean with SEM. Multiple t-tests were conducted for statistical analysis. **** P < 0.0001. i Representative ex vivo lung bioluminescence images from spontaneous metastasis in h. j Quantification of ex vivo lung bioluminescence from h, i. Ordinary one-way ANOVA with Tukey’s multiple comparisons tests was conducted for statistical analysis. * P < 0.05. Lung colonization of control (k) or CXCL9/10-overexpressing MDA-LM2 cancer cells (l) pretreated with 5 µM JNKi or vehicle for 48 h, quantified by lung bioluminescence. Representative bioluminescence images are shown. P values were calculated by unpaired one-tailed t-tests; n = 10 mice per group from two independent experiments. j–l Data points depict biological replicates and whiskers show minimum and maximum.

