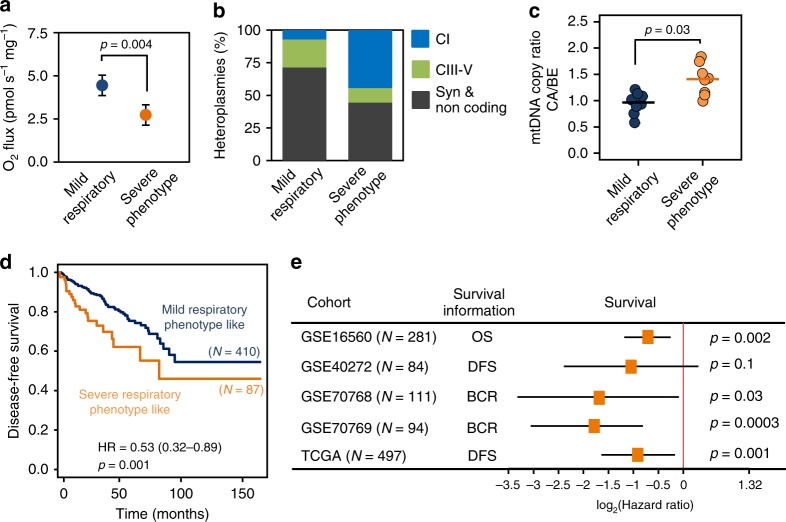
Fig. 8. Association of severe respiratory phenotype and survival.
a Glutamate&malate-linked OXPHOS capacity (GMP) in the severe (orange) versus mild (blue) respiratory phenotype PCa tissue samples. Data are presented as mean values ± SD. Differences were tested for significance using Wilcoxon rank-sum test. b Relative proportion of synonymous (gray), non-synonymous CIII-IV (green) and non-synonymous CI (blue) mtDNA mutations detected in samples of the mild and severe respiratory phenotype tumors, respectively. c mt-CN ratios (CA/BE) as determined by duplex qPCR in the severe (orange, N = 8) versus mild (blue, N = 8) respiratory phenotype PCa samples. Mean and individual data points are presented and differences were tested for significance using Wilcoxon rank-sum test. d–e Gene expression profiles and survival information (OS, overall survival; DFS, disease-free survival; BCR, time to biochemical recurrence) were retrieved for five prostate cancer cohorts. The metagene set of 11 genes (Table 2) highly correlated to the gene expression profile of the severe respiratory phenotype PCa samples was used to dichotomize the PCa cohorts into samples exhibiting a mild or a severe respiratory phenotype-like gene expression signature and perform Kaplan–Meier and Hazard ratio (HR) analysis of survival probabilities. d Disease-free survival Caplan–Meier curves for the PRAD-TCGA cohort (N = 497). A HR of 0.53 (confidence interval 0.32–0.89, p = 0.001, stratified log-rank test) was calculated for this set. e Survival probabilities (HRs and confidence intervals, CI), for all five independent prostate cancer cohorts (N = 1067). Cases exhibiting a severe respiratory phenotype-like metagene signature showed a significantly shorter survival probability in four of the five cohorts. HRs were tested using stratified log-rank tests. Source data are provided as a Source Data file.

