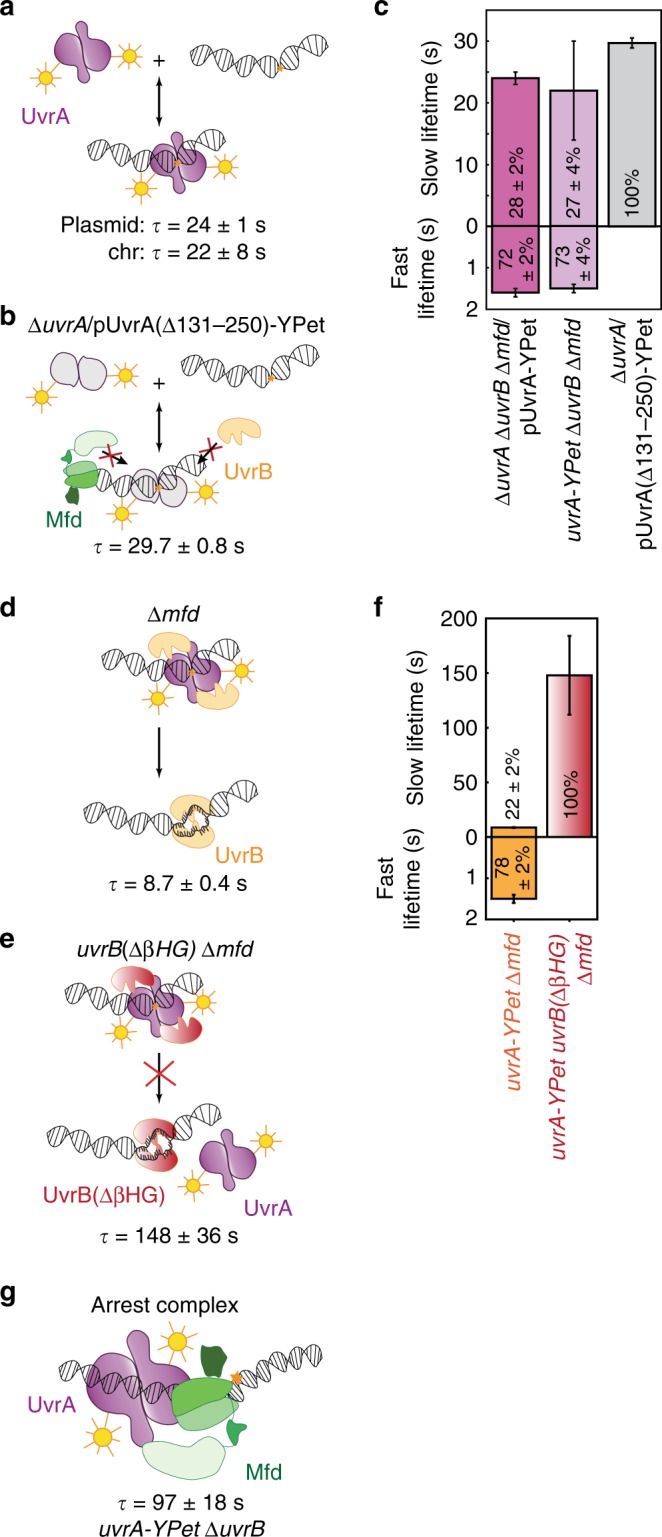
Fig. 3. DNA-binding lifetimes of UvrA-YPet in the presence of UvrB.

a Kinetics of UvrA-YPet interactions with DNA can be detected in the absence of UvrB and Mfd, in ΔuvrA ΔuvrB Δmfd cells expressing UvrA-YPet from a low-copy plasmid or in ΔuvrB Δmfd cells expressing UvrA-YPet from the chromosome. b Cartoon illustrates DNA binding by the mutant UvrA(Δ131–250)-YPet, which is defective in interacting with UvrB and Mfd. c Bar plots represent lifetimes of DNA-bound UvrA-YPet (plasmid: n = 34,927 counts from five repeats; chromosomal: n = 9703 counts from three repeats) and mutant UvrA(Δ131–250)-YPet (a total of n = 88,232 counts from four repeats) in the corresponding genetic background. Lifetimes were obtained from globally fitting the cumulative residence time distributions (CRTDs) (see also Supplementary Fig. 2a–f). Where two kinetic sub-populations are detected, the fast lifetime is displayed in the lower panel. Percentage represents the amplitude of kinetic sub-populations. d Cartoon illustrates loading of UvrB by UvrA. This may occur at sites of undamaged or damaged DNA. e Cartoon illustrates the complex formed by UvrA and the mutant UvrB(ΔβHG) that is deficient in loading reaction. f Bar plots represent lifetimes of DNA-bound UvrA-YPet in Δmfd cells expressing either wild-type UvrB (n = 29,743 counts from 11 repeats) or mutant UvrB(ΔβHG) (n = 16,353 counts from two repeats). Lifetimes were obtained from globally fitting the CRTDs, with more than 1000 counts each CRTD (see Supplementary Fig. 2g–j). Where two kinetic sub-populations are detected, the fast lifetime is displayed in the lower panel. Percentage represents the amplitude of kinetic sub-populations. g Cartoon of the arrested Mfd-UvrA complex. See also Supplementary Fig. 3a, b. Error bars are standard deviations from ten bootstrapped CRTDs. Source data are provided as a Source Data file.
