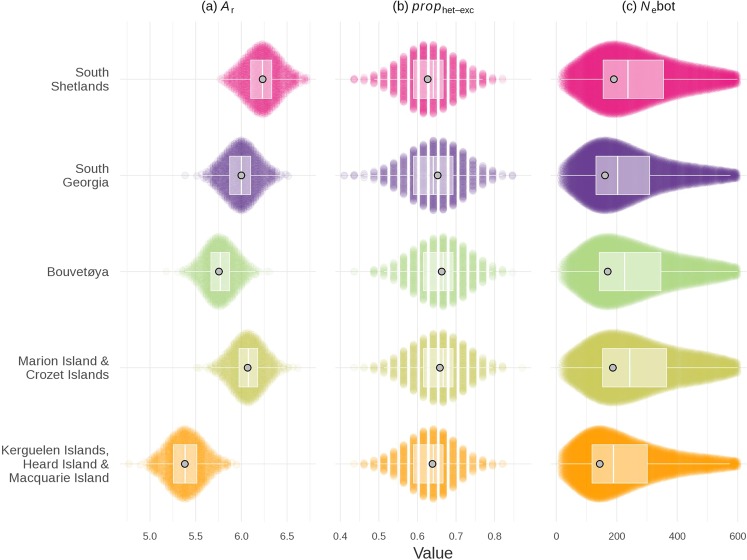
Figure 3.
Patterns of genetic diversity and bottleneck signatures across the geographic range of the Antarctic fur seal. (a) Genetic diversity summarised as allelic richness (Ar); (b) The proportion of loci in heterozygosity excess (prophet-exc) calculated for the TPM80 model; (c) Estimated bottleneck effective population sizes (Nebot). Data are summarised according to the five main populations identified by the STRUCTURE analysis (see Results for details). To facilitate visual comparisons among populations with different sample sizes while incorporating sampling error, we plotted 1,000 subsets of ten randomly sampled individuals per population as Sinaplots, with the exception of the sinaplot for Nebot, which shows parameter values for 5,000 accepted simulations based on 181 individuals per population. Boxplots (centre line = median, bounds of box = 25th and 75th percentiles, upper and lower whiskers = largest and lowest value but no further than 1.5 * inter-quartile range from the hinge) are superimposed with light grey points representing maximum densities. Bottleneck measures for Marion and Crozet Islands should be interpreted with caution due to admixture.

