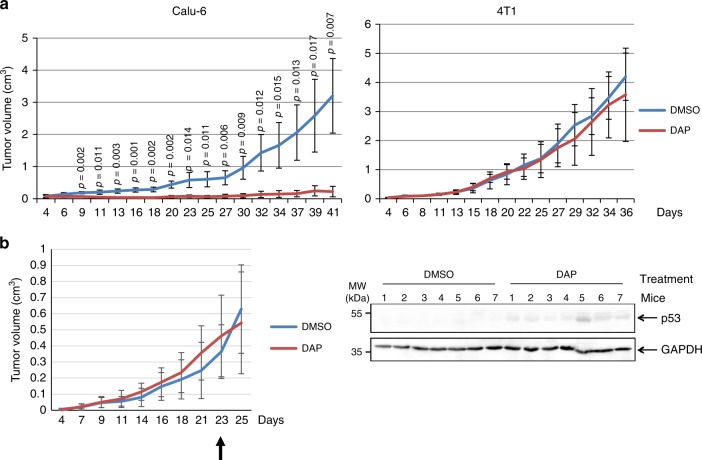
Fig. 4. DAP corrects UGA nonsense mutations in vivo.
a Twenty-eight nude mice were injected with Calu-6 or 4T1 cells to promote tumor development. The mice were exposed to DMSO or DAP for about 5 weeks and tumor size was measured at different time after cell injection and plotted on the graph. For each experimental condition, 7 mice were used. b Fourteen nude mice were injected with Calu-6 cells to promote tumor development. The mice were exposed to DMSO or DAP when the average tumor size reached about 0.4 cm3. The arrow indicates the starting time of the exposure to DMSO or DAP. For each experimental condition, 7 mice were used. The tumor growth curve is presented on the left, and the right panel shows the western-blot analysis of p53 protein in the Calu-6-cell tumors of the seven DMSO-exposed and seven DAP-exposed mice. GAPDH was used as loading control. A molecular weight marker is indicated to the left of the gel. The results presented in this figure are representative of two independent experiments. p-values (p) were calculated using Student’s t-test. Source data are provided as a Source Data file.

