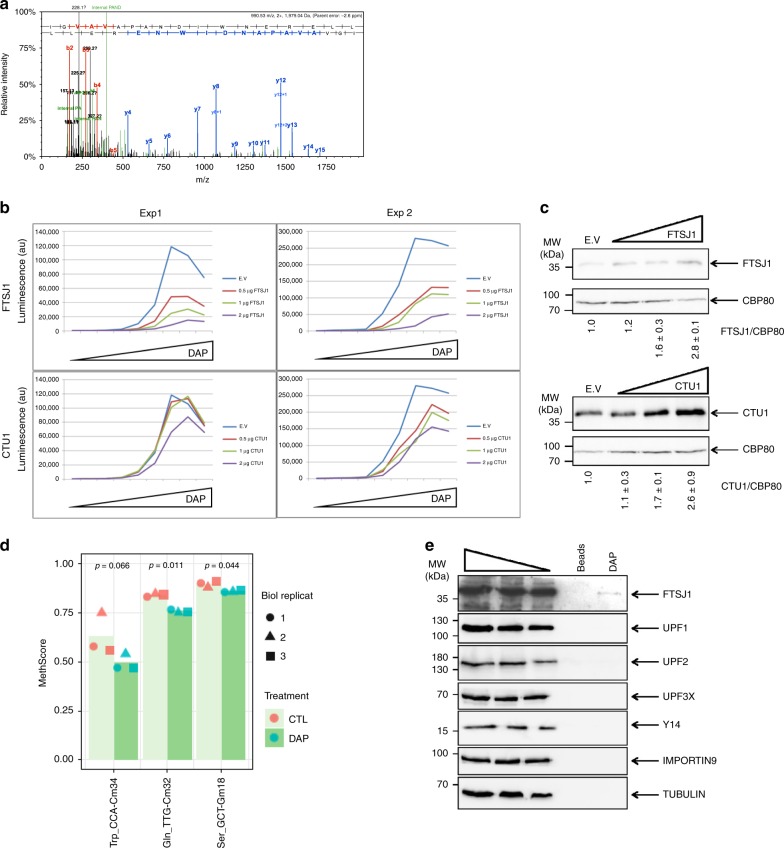
Fig. 5. DAP interferes with the activity of FTSJ1.
a Determination by tandem mass spectrometry of the amino acid incorporated at the PTC position. Firefly luciferase from HEK293FT cells transfected with the Fluc-int-UGA construct was immunoprecipitated and digested with trypsin. The MS/MS spectrum of the peptide containing the PTC position and the sequence determination are shown. The upper red and blue sequences indicate the amino acids validated, respectively, by detection of Nter and Cter peptide fragments (b and y ion series). Peptide fragments y6 and y7 clearly identify tryptophan (W) at the PTC position. The black peaks correspond to non-attributed mass-to-charge ratio (m/z) values. The green peaks are internal fragments that do not contain an extremity of the peptide. b The efficiency of UGA readthrough by DAP decreases with increasing amounts of FTSJ1 but not with increasing amounts of CTU1. Readthrough efficiency was determined by measuring luciferase activity in HeLa cells co-transfected with the firefly luciferase construct described in Fig. 1b and with increasing amounts of an expression vector for either FTSJ1 or CTU1 (0.5, 1, or 2 µg). The empty expression vector (E.v.) was used as control. The cells were then exposed to 0, 0.39, 0.78, 1.56, 6.25, 25, 100, 300, or 600 µM DAP for 24 h before measuring the luciferase activity. The experiment was performed twice and the results of both experiments (Exp1 and Exp2) are shown. c Western blot analysis of FTSJ1 and CTU1. d 2′-O-methylation analysis of tRNATrp, tRNASER, and tRNAGLN by RiboMethSeq. HeLa cells were incubated for 24 h with DMSO or with 25 µM DAP. A MethScore was attributed to each tRNA 2′-O-methylation in tRNA purified from HeLa cells treated with DAP (dark green histogram) or DMSO (light green histogram). The results of three independent experiments are indicated with the symbols square, point, or triangle. e Analysis of DAP affinity column eluates shows that DAP interacts with FTSJ1. HeLa-cell extract was incubated with DAP covalently bound to beads or with beads alone. Proteins bound to the columns were eluted with excess DAP and the eluates analyzed by western blotting. A molecular weight marker is indicated to the left of each gel. p-values (p) were calculated using Student’s t-test. Source data are provided as a Source Data file.

