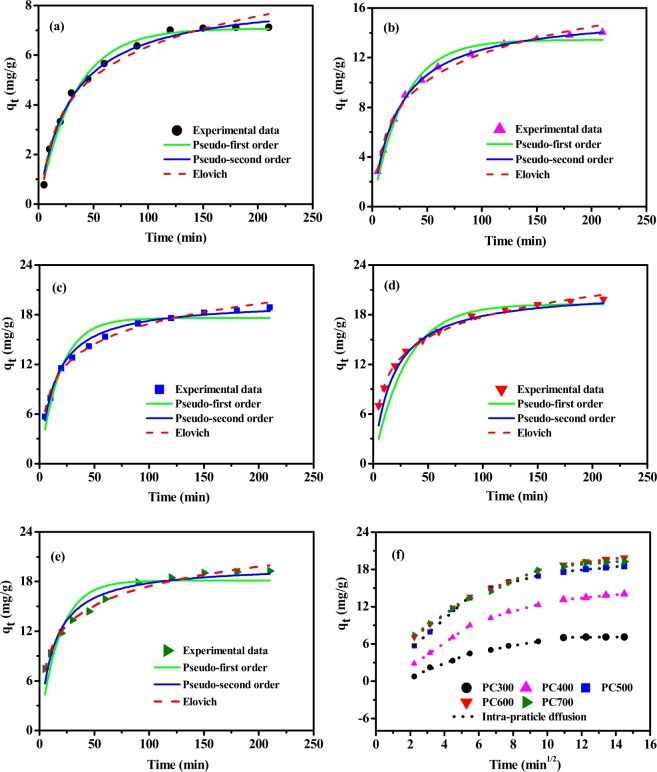
Figure 3.
Use of various models to fit the kinetic data recorded for the adsorption of p-nitrophenol onto biochar samples (qt: amount of p-nitrophenol adsorbed at time point t) prepared at different pyrolysis temperatures: (a) PC300, (b) PC400, (c) PC500, (d) PC600, and (e) PC700 via the nonlinear regression method; (f) intra-particle diffusion model for five biochar samples. Please note that in the mentioned adsorption reaction, the concentration of p-nitrophenol was 100 mg/L and the dosage of biochar was 0.1 g/0.02 L. The adsorption experiments were conducted at a pH of 6 and at 35 °C, and the amount of p-nitrophenol adsorbed onto biochar was measured at the indicated time points.

