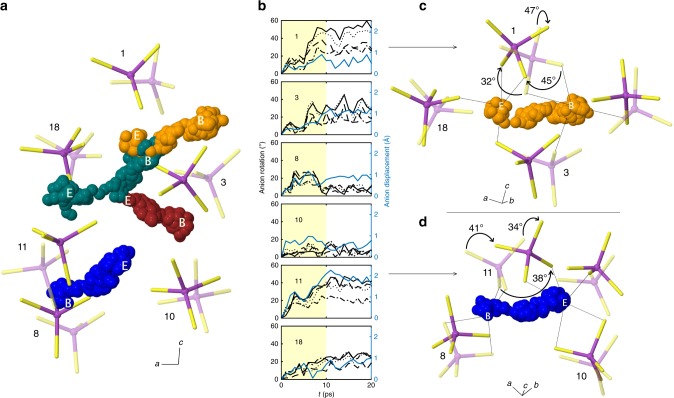
Fig. 4. Illustration of cation–anion cooperative motion at 300 K.
a Distinct colored spheres represent the positions of four different lithium ions superimposed at 40-fs intervals over a 10-ps trajectory; the initial and final positions of these ions are labeled “B” and “E”, respectively. Tetrahedral PS4 anions are colored magenta (phosphorus) and yellow (sulfur). The initial positions of the anions at the start of the migration event are shown with partial transparency; opaque depictions indicate final positions. Numeric labels identify individual anions. For clarity, only a portion of the simulation cell is shown. b Angular (black) and linear (blue) displacements of the PS4 anions as a function of simulation time. (Angular displacements are plotted for each of the four vectors parallel to a P–S bond in a PS4 anion.) Yellow shading represents the time window over which a cooperative displacement occurs. c, d Diffusion mechanisms for the orange and blue Li ions from panel (a), illustrating the coupling of cation transport with the reorientation of anions. Black lines illustrate the evolution of the coordination environment of lithium as it moves from the beginning (B) and end points (E) of the migration displacement. Arrows identify the two anions (numbers 1 and 11) that exhibit the largest rotational displacements. The magnitudes of the largest anion reorientations are identified.

