
Fig. 5. Power spectra of the normalized velocity autocorrelation function for crystalline γ-Li3PS4 (top) and glassy (bottom) Li3PS4 at 300 K.
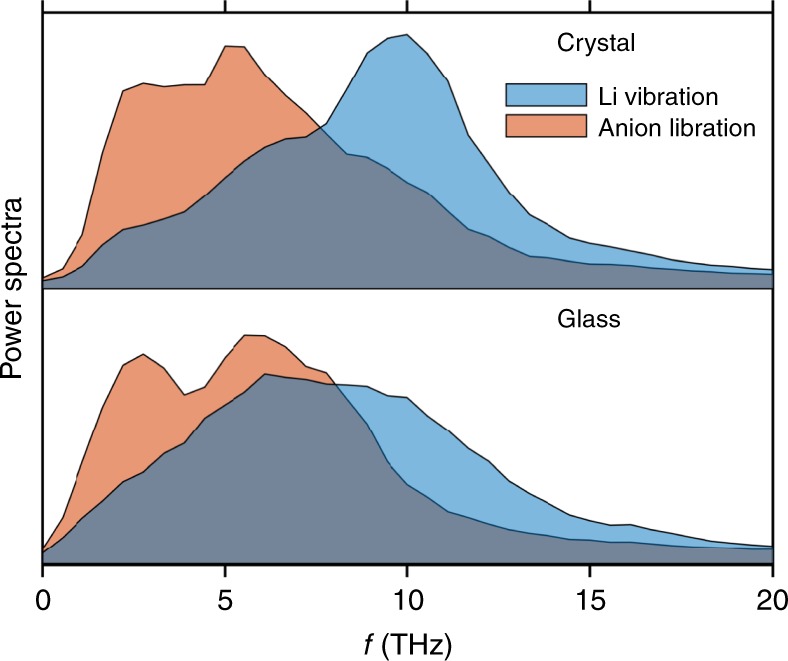
Lithium vibrations are shown in blue, and anion librations appear in red.
Official websites use .gov
A
.gov website belongs to an official
government organization in the United States.
Secure .gov websites use HTTPS
A lock (
) or https:// means you've safely
connected to the .gov website. Share sensitive
information only on official, secure websites.
Lithium vibrations are shown in blue, and anion librations appear in red.