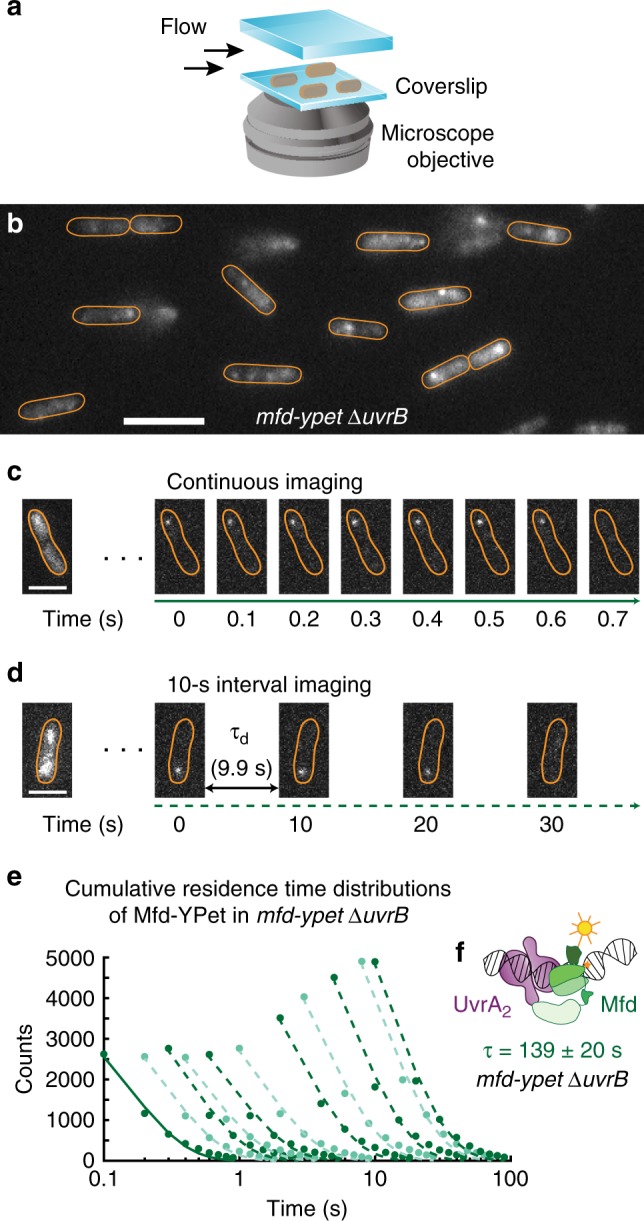
Fig. 2. Measurements of Mfd-YPet binding lifetimes in cells lacking UvrB.

a Cells expressing fluorescent Mfd-YPet were grown to early exponential phase and loaded in a flow cell. Cells were imaged under constant supply of aerated growth medium for several hours. b Representative fluorescence image of mfd-YPet ΔuvrB cells upon exposure to 514-nm light. Scale bar, 5 µm. Cell outlines (orange) are provided as a guide to the eye. c Fluorescence data were collected in video format, with 0.1-s frames taken continuously. Due to fast photobleaching of the fluorescent protein YPet, continuous imaging hinders the observation of binding events on the second timescale. Scale bar, 2 µm. d To extend the observation time window up to several minutes, images can be acquired with a dark interval (τd) inserted between consecutive 0.1-s frames. Scale bar, 2 µm. e Cumulative residence time distributions (CRTDs; circles) of Mfd-YPet in mfd-YPet ΔuvrB cells and the corresponding single-exponential fits (lines) obtained from continuous imaging (solid line) or interval imaging (dashed lines) with a dark interval (τd) between consecutive frames. τd increases from 0.1 s to 9.9 s (left to right, see Methods). CRTDs are constructed from eight biologically independent repeats (Nrepeats) totaling nobs = 37,682 individual observations (also see source data file). f Global fitting of CRTDs in (e) yields a lifetime of 139 ± 20 s, suggesting Mfd (green) is arrested in complex with UvrA2 (purple) in cells lacking UvrB. Error bars are standard deviations from ten bootstrapped CRTDs. Source data are provided as a Source Data file.
