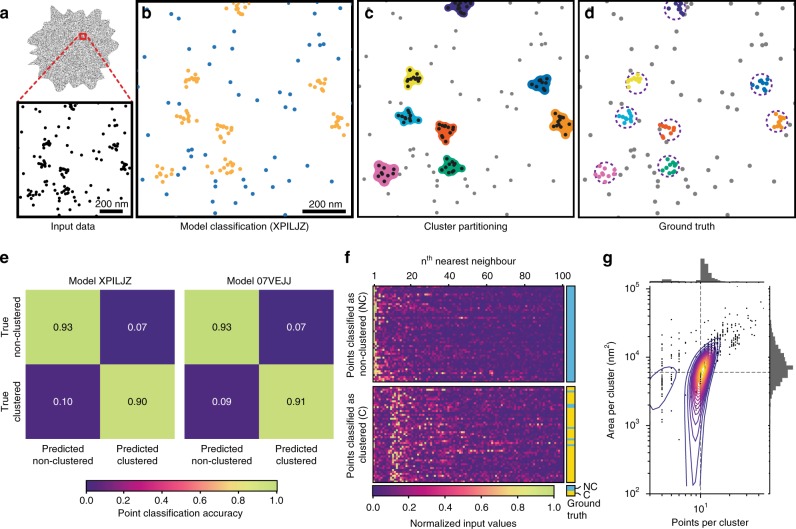
Fig. 2. Testing of two example models using simulated data.
a Input data are the point coordinates, which are evaluated (b) by a model and classified as either clustered (gold) or non-clustered (blue). This information is used to partition the clustered points into spatially similar clusters, around which a cluster shape can be formed (c). The original (known) clustering assignment (d, dashed circles indicate the maximum distance clustered points may be positioned from the cluster center) may be used in comparison to assess the accuracy of the process. Accuracy is represented as confusion matrices (e) for two models generated using different configurations which report good accuracy. f A random sample of the normalized input data (to 100 near neighbors), separated into those points which were classified by Model XPILJZ as non-clustered (top) or clustered (bottom); the true label for each point is shown on the right (blue: non-clustered, yellow: clustered). g Output data faithfully describes the original clustering scenario, here the clusters contained 10 points within a maximum radius of 40 nm (indicated by dashed lines).

