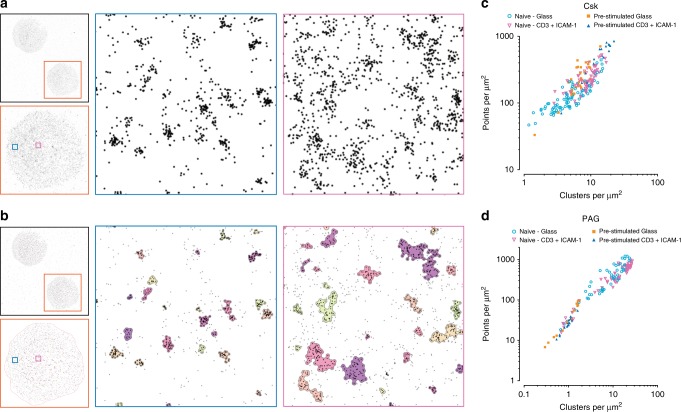
Fig. 4. Analysis of dSTORM data with Model 87B144.
Activated primary human T cells stained for Csk showing either localized points (a), or resulting cluster outlines (b), of two regions (blue, peripheral, and magenta, central). Clustering data obtained from individual naive or pre-stimulated cells for Csk (c) or PAG (d) staining in either non-activating (supported on glass) or activating (anti-CD3 + ICAM-1) conditions. Data are from three independent experiments and are presented as median values from each cell; Csk, naive—glass: 85 cells, Csk, naive—CD3 + ICAM-1: 71 cells, Csk, Pre-stimulated—glass: 30 cells, Csk, pre-stimulated—CD3 + ICAM-1: 19 cells, PAG, naive—glass: 53 cells, PAG, naive—CD3 + ICAM-1: 65 cells, PAG, Pre-stimulated—glass: 14 cells, PAG, pre-stimulated—CD3 + ICAM-1: 18 cells.

