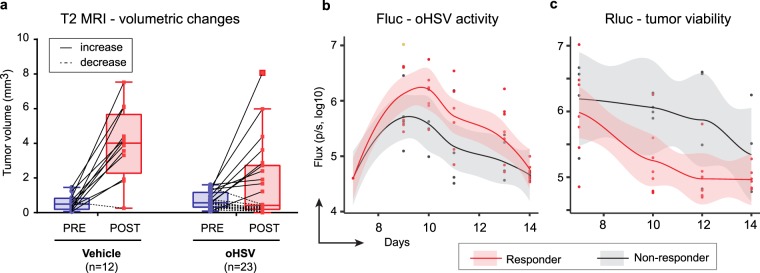
Figure 2.
Analysis of oHSV treatment responders vs. non-responders. (a) MRI-measured tumor volumes are plotted with bars separately for vehicle (PBS) and oHSV treatment groups. Tumor volumes before (PRE; blue) and after treatment (POST; red) are plotted with a solid line for increased volumes or dotted line for decreased or unchanged volumes. Individual experimental data and MRI schedule are detailed in Fig. S3,b, e,h. Optical bioluminescent images were captured before and after injection of the appropriate substrate for firefly luciferase (Fluc; b) and renilla (Rluc; c) at multiple-time points in experiment 2. Scatter plots (dot), non-linear regression curve (solid line) and two-sided 95% confidential intervals (shadow) are shown for each graph. oHSV treatment mice were divided in two groups based on tumor responses by MRI from panel a: Non-responder (gray shadow with solid black line) and responder (light red shadow with solid red line). BLI and MRI results of Individual mouse on the time-course are also shown in Fig. S3.

