Figure 3.
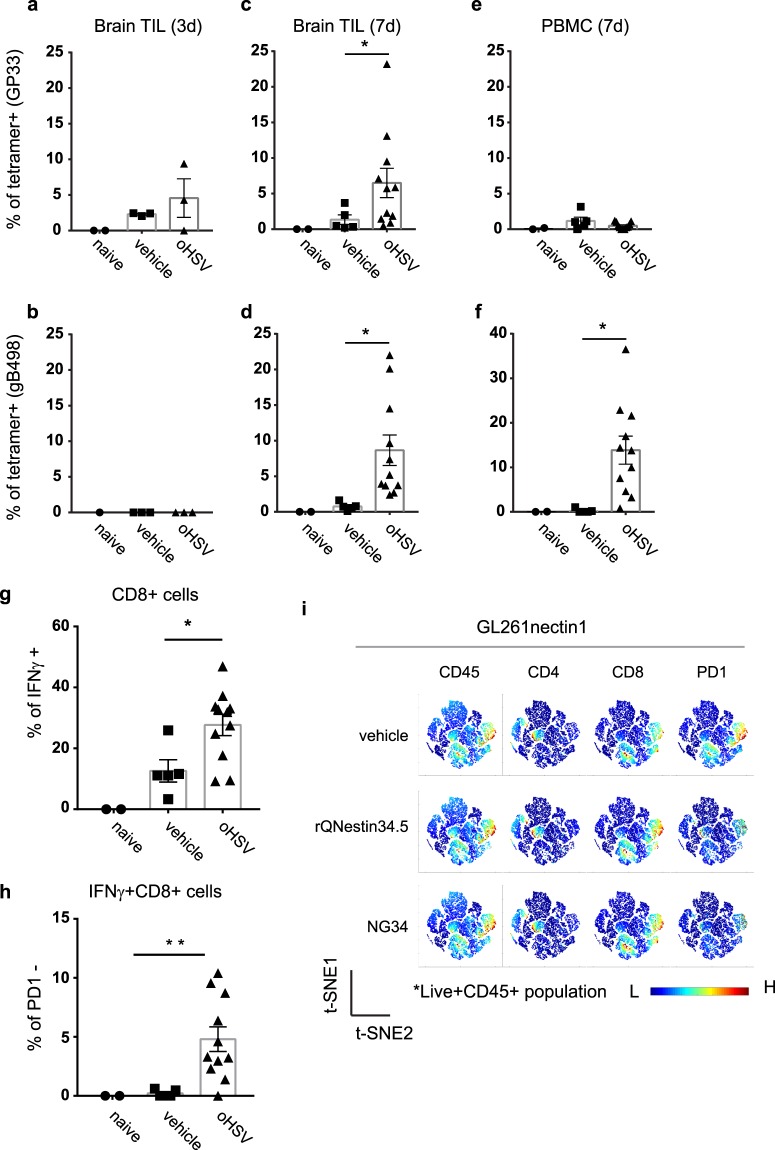
Immune cell analyses. (a–f) CD8+ T cells against GP33 (GBM antigen; panel a,c,e) or gB498 (oHSV antigen; panel b,d,f), 3 (left panels) or 7 (middle and right) days after oHSV or PBS injection in GBMs (labeled as CT2Agp33nectin1) implanted in mouse brains. CD8+ T cells were gated from CD45+TCRβ+ population isolated by Percoll gradient-enriched leukocytes from excised brains (Brain TIL) and PBMCs. GP33 or gB498+ CD8+ T-cells were stained with corresponding tetramers. Controls were from tumor-free native mouse brains (Naïve) compared to vehicle or oHSV injected mouse brains. Each dot represents an individual mouse sample. The bars represent the mean and the range represents the SEM. (g) Percent of GBM-infiltrating whole CD8+ T cells and (h) PD-1-negative CD8+ T cells that express IFNγ, 7 days after oHSV injection. *p < 0.05, one-way ANOVA; (i) Unbiased immune marker analysis by t-Distributed Stochastic Neighboring viSNE revealed PD-1 downregulation on the cytotoxic CD8+ T cells in brains from murine GL261nectin1 GBM-bearing C57Bl/6 mice after oHSV treatment (rQNestin34.5 and NG3420) at day 7 compared to naïve control group.

