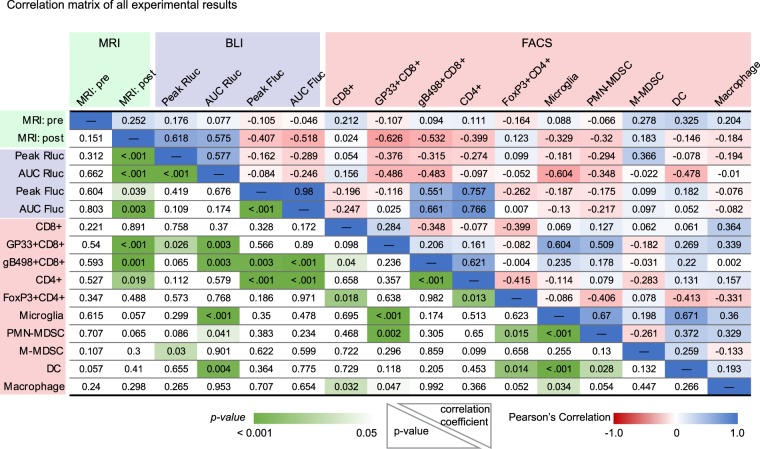
Figure 5.
Statistical tests of significance and Pearson’s correlation coefficients between measured variables in the tumor microenvironment. Three independent experiments from MRI, BLI and FACS were aggregated to analyze correlations between two variables. Pearson’s correlation coefficient and p values for each variable against the other is shown in the upper right and lower left of the table, respectively. The color gradient shows the strength of correlation, as direct (blue), inverse (red), and its significance (green). Details are in the Materials and Methods section.

