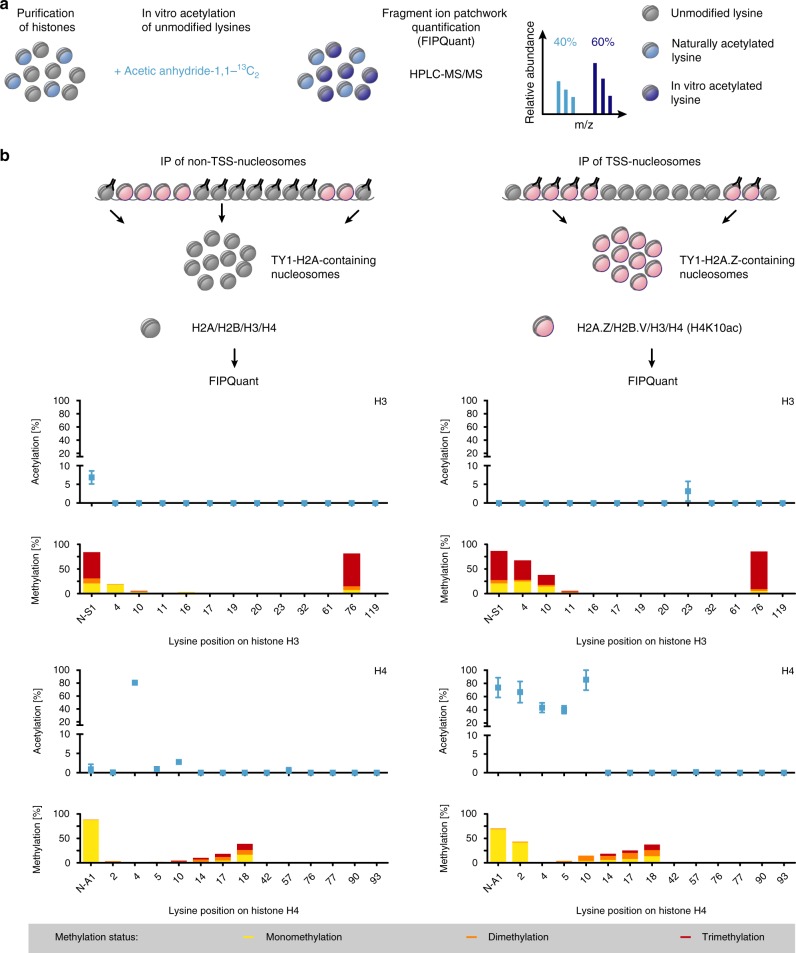
Fig. 2. Identification of acetyl and methyl marks enriched at TSSs.
a Outline of the Fragment Ion Patchwork Quantification (FIPQuant) methodology. Following histone purification, unmodified lysines were in vitro labeled with a C13-acetyl mark and analyzed by mass spectrometry. The levels of site-specific lysine acetylation were determined using FIPQuant. b PTM-patterns of H3 and H4 from non-TSS- and TSS-nucleosomes. TSS- and non-TSS-nucleosomes were enriched by immunoprecipitation of TY1-H2A.Z and TY1-H2A-containing nucleosomes, respectively. The acetylation percentages [%] (blue) represent the averages of the median values from each of the independent experiments (left panel n = 3, right panel n = 7) determined by FIPQuant. Error bars indicate standard deviations. Lysine-specific mono- (yellow), di- (orange) and/or trimethylation (red) levels are shown for H3 and H4 from non-TSS- (left panel; n = 3) and TSS-nucleosomes (right panel; n = 7) and are plotted as stacked bars representing the averages of the estimated methylation percentages based on identified mono-, di- and trimethylated spectra. Supplementary Fig. 4 shows the data of each replicate. Source data are provided as a Source Data file.

