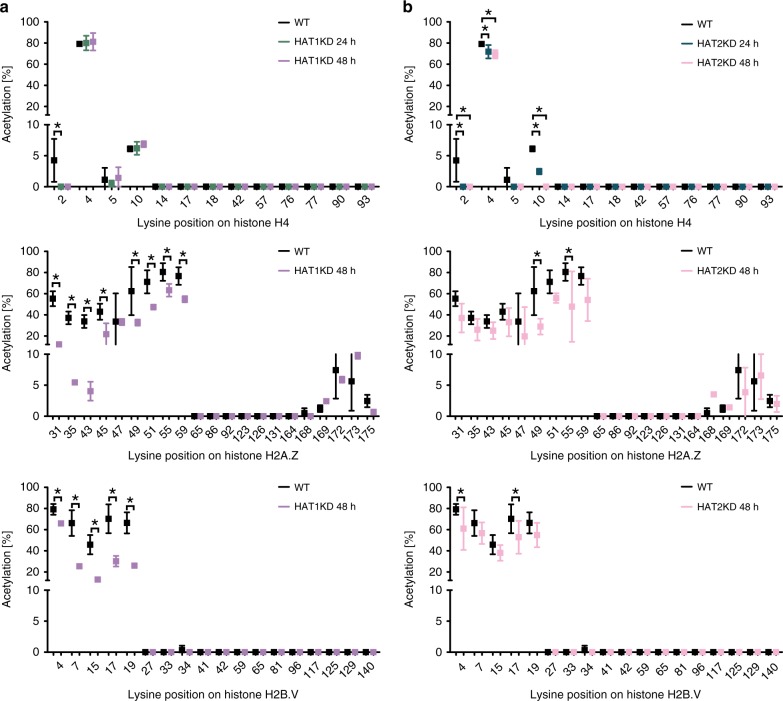
Fig. 5. HAT1 and HAT2 acetylate histones at TSSs.
a Levels of lysine-specific acetylation for H4, H2A.Z and H2B.V are shown for WT cells and after depletion of HAT1. H4 acetyl marks were quantified by FIPQuant using histones extracted from WT cells (black, n = 3) and from 2T1 cells, which were depleted of HAT1 for 24 h (green, n = 3) or 48 h (purple, n = 3). H2A.Z and H2B.V acetyl marks were quantified using histones from immunoprecipitated TSS-nucleosomes (black; n = 7) and 2T1 cells, depleted for HAT1 for 48 h (purple; n = 3). The acetylation percentages [%] represent the averages of the median values from each of the independent experiments determined by FIPQuant. Error bars indicate standard deviations. Supplementary Fig. 9a shows the data for each replicate. b Levels of lysine-specific acetylation for H4, H2A.Z and H2B.V are shown for WT cells and after depletion of HAT2. H4 acetyl marks were quantified by FIPQuant using histones extracted from WT cells (black; n = 3) and from 2T1 cells, which were depleted of HAT2 for 24 h (blue; n = 3) or 48 h (rose; n = 3). H2A.Z and H2B.V acetyl marks were quantified using histones from immunoprecipitated TSS-nucleosomes of WT cells (black; n = 7) and 2T1 cells, depleted of HAT2 for 48 h (rose; n = 2). The acetylation percentages represent the averages of the median values from each of the independent experiments determined by FIPQuant. Error bars indicate standard deviations. Supplementary Fig. 9b shows the data for each replicate. Source data are provided as a Source Data file. Multiple t-tests between the different conditions were performed and individual p-values for each lysine position were computed using the two-way ANOVA approach. The statistical significance was determined using the Holm-Sidak method77,78 and ‘statistically significant’ adjusted p-values (padj < 0.05) were marked with asterisks (exact p-values are listed in Supplementary Data 7).

