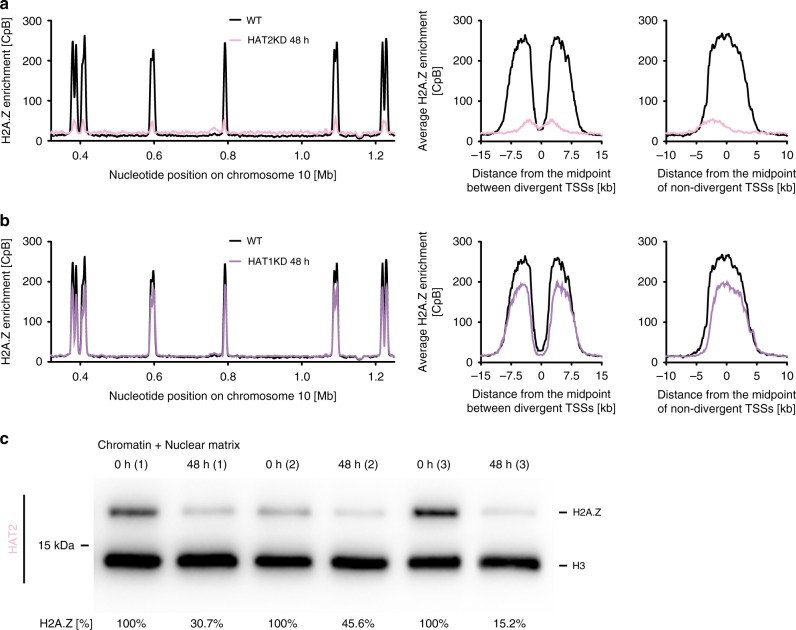
Fig. 6. HAT2 depletion leads to reduced H2A.Z deposition.
a MNase-ChIP-seq data of histone variant H2A.Z before (black) and after 48 h HAT2 depletion (rose) are shown across a representative region of chromosome 10 (left panel) and averaged across divergent (n = 37) and non-divergent (n = 49) TSSs (right panel). The MNase-ChIP-seq data are normalized to the total number of reads and plotted as counts per billion reads [CpB]. Data from replicate 2 are shown, for all replicates see Supplementary Fig. 12. b MNase-ChIP-seq data of histone variant H2A.Z before (black) and after 48 h HAT1 depletion (purple) are shown across a representative region of chromosome 10 (left panel) and averaged across divergent (n = 37) and non-divergent (n = 49) TSSs (right panel). The ChIP-seq data are normalized to the total number of reads and plotted as counts per billion reads [CpB]. Data from replicate 1 are shown, for all replicates see Supplementary Fig. 13. c Western blot of chromatin-associated proteins extracted from 2T1 cells, which were depleted of HAT2 (n = 3) for 0 h or 48 h. Loaded are the insoluble fractions, containing chromatin-bound and nuclear matrix material. H2A.Z [%] refers to the H2A.Z/H3 ratio. The H2A.Z/H3 ratio at 0 h HAT2-depletion was set to 100%. H2A.Z/H3 ratios were calculated by quantifying the H2A.Z and H3 signal over the background for each lane signal using ImageJ (see Supplementary Data 3). Source data are provided as a Source Data file.

