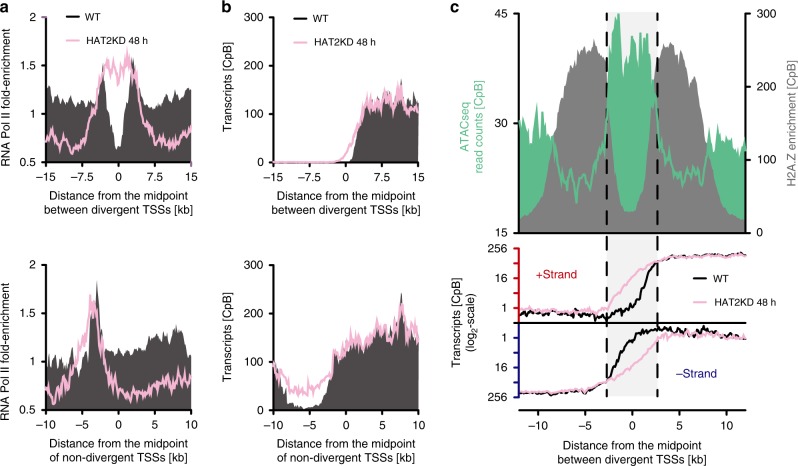
Fig. 7. Depletion of HAT2 affects sites of transcription initiation.
a ChIP-seq data of RNA Pol II before (black) and after 48 h HAT2 depletion (rose) are averaged across divergent TSSs (n = 37; upper panel) and non-divergent TSSs (n = 49; lower panel). The ChIP-seq data are normalized to input data. Data from replicate 1 are shown, for all replicates see Supplementary Fig. 14. b RNA-seq data showing transcripts derived from the +strand before (black) and after 48 h HAT2 depletion (rose) are averaged across divergent TSSs (n = 37; upper panel) and non-divergent TSSs (n = 49; lower panel). The data are normalized to a spike-in control to account for differences in total RNA levels per cell after HAT2 depletion and plotted as counts per billion reads [CpB]. Shown is the average from three RNA-seq experiments (for normalization factors see Supplementary Data 5). c The ATAC-seq data (green)31 and MNase-ChIP-seq data of H2A.Z (gray) are derived from wild type (WT) cells and are averaged across divergent TSSs (n = 37; upper panel). The ATAC-seq and MNase-ChIP-seq data are normalized to the total number of reads plotted as counts per billion reads [CpB]. RNA-seq data showing transcripts derived from the +strand or the −strand before (black) and after 48 h HAT2 depletion (rose) are averaged across divergent TSSs (n = 37; lower panel). The data are normalized to a spike-in control to account for differences in total RNA levels per cell after HAT2 depletion and plotted as counts per billion reads [CpB]. Source data are provided as a Source Data file.

