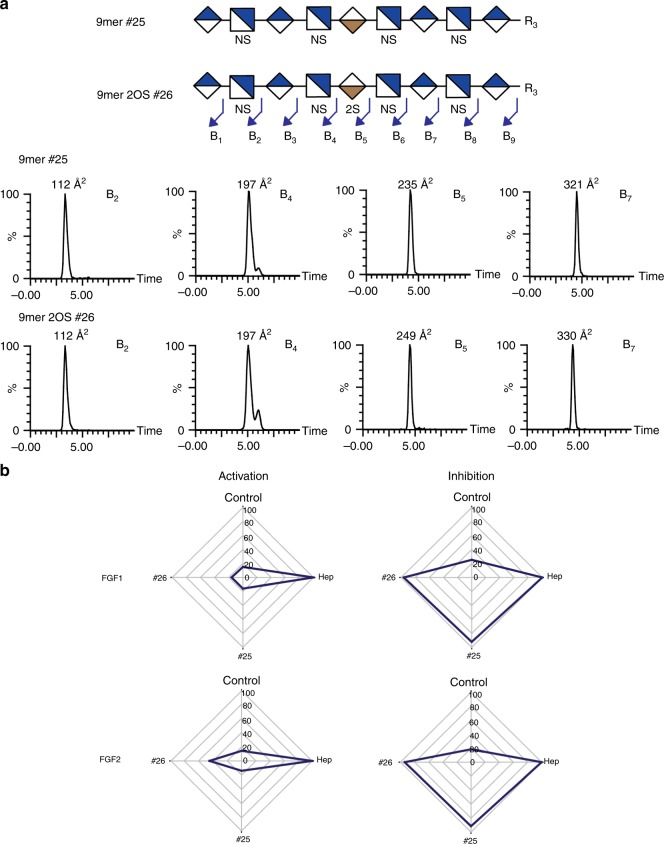
Fig. 4. MS2 sequencing of two 9mer saccharides.
HS structures #25 and #26 were fragmented in the trap and separated through IMMS to create a defined set of CCS values for each fragment. IMMS of fragments (a) represent B ion fragments from #25, and #26, indicating that the 2O-sulfate is on the IdoA at position 5. Fragment ions from B/Y/C/Z are displayed in Supplementary Tables 15 and 16. b Radar chart illustration of BaF3 cell activation and inhibition assays of HS structures #25 and #26. Activation (cell proliferation) assays were performed with fibroblast growth factor 1 (FGF1) or FGF2 (1 ng/mL) and standards #25/26. Heparin (3 μg/mL) was used as positive control, while FGF1 or FGF2 alone was used as negative control. Inhibition assays were performed with the same compounds (3 μg/mL) in the presence of a sub-maximal dose of heparin (0.1 μg/mL). Cell proliferation results were expressed as a percentage of heparin activity set as 100%. Data for panel b are presented as mean ± standard deviation, n = 3. Source data are provided as a Source Data file.

