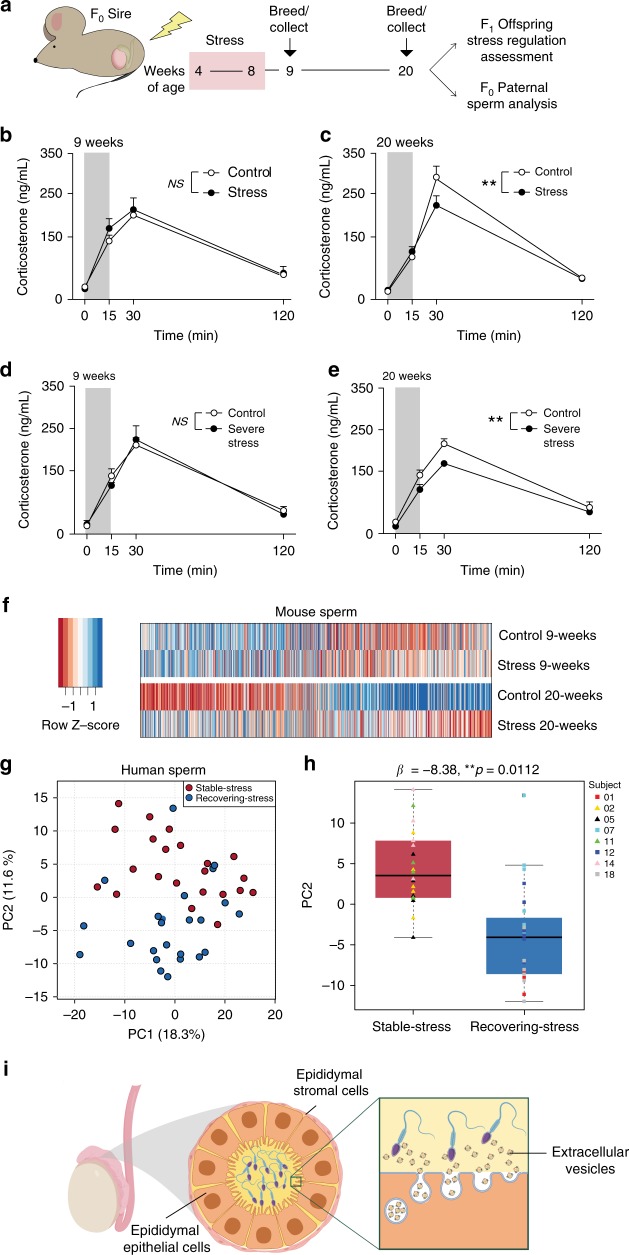
Fig. 1. Stress dynamics impact intergenerational transmission and sperm miRNA content.
a F0 breeding time course with periods of stress (4 weeks) and recovery (1 or 12 weeks after stress) for sperm and F1 offspring assessment. b Transmission of a stress phenotype in the corticosterone response to an acute 15-min restraint (gray bar) did not occur for offspring conceived at 9 weeks (two-way rmANOVA, time (F(3,39) = 88.07, p = 2.0375 × 10⁻¹⁷), paternal treatment (F(1,13) = 0.5528, NS p = 0.4704, N = 7–8 offspring/paternal treatment). c Offspring conceived at 20 weeks had altered stress reactivity (two-way rmANOVA, interaction of paternal treatment × time (F(3,42) = 3.718, p = 0.0185), time (F(3,42) = 138.5, p = 8.3427 × 10⁻²²), paternal treatment (F(1,14) = 1.179, p = 0.2959)), with significant reduction in the maximal rise of corticosterone at 30 min (Bonferroni’s post hoc test, t(56) = 3.29, **adjusted p = 0.0069, N = 8 offspring/paternal treatment). d Doubling F0 stress (severe stress) did not transmit a stress phenotype for offspring conceived at 9 weeks (two-way rmANOVA, time (F(3,39)=92.52, p = 8.8203 × 10⁻¹⁸; paternal treatment F(1,13)=0.0667, NS p = 0.8002, N = 7–9 offspring/paternal treatment). e Severe stress transmission altered stress reactivity for offspring conceived at 20 weeks (two-way rmANOVA, interaction of paternal treatment × time (F(3,30) = 2.600, p = 0.0705), time (F(3,30) = 173.5, p = 4.4839 × 10⁻¹⁹; paternal treatment (F(1,10) = 8.199, p = 0.0169), with significant reduction in the maximal rise of corticosterone at 30 min (Bonferroni’s post hoc test, t(40) = 3.549, **adjusted p = 0.0040, N = 6 offspring/paternal treatment). Error bars represent mean ± SEM. f Expression patterns for all sperm miRNA detected by RNA sequencing as indicators of germ cell reprogramming, correlating with timing of phenotypic transmission. miRNA values were averaged within treatment groups (N = 6–8 samples/paternal treatment/time post-stress). g Examination of sperm miRNA dynamics and perceived stress in a human cohort. Principal component (PC) analysis of sperm based on all sequenced miRNA demonstrated the influence of perceived stress dynamics on sperm expression patterns, where PC2 largely segregated samples collected from ‘stable-stress’ (blue circles) and ‘recovering-stress’ subjects (red circles). N = 5–6 sperm samples/subject/stress phenotype group (see Methods). h Quantification showing significant association between a subject’s sample PC2 score and its stress phenotype group (regression model β-coefficient = −8.38, **p = 0.0112). Data are median with first and third quartiles (box) and top and bottom quartiles (whiskers) indicated. Individual data points are colored to denote subject. i Hypothesized model of maturing sperm interacting with extracellular vesicles within the caput epididymal lumen.

