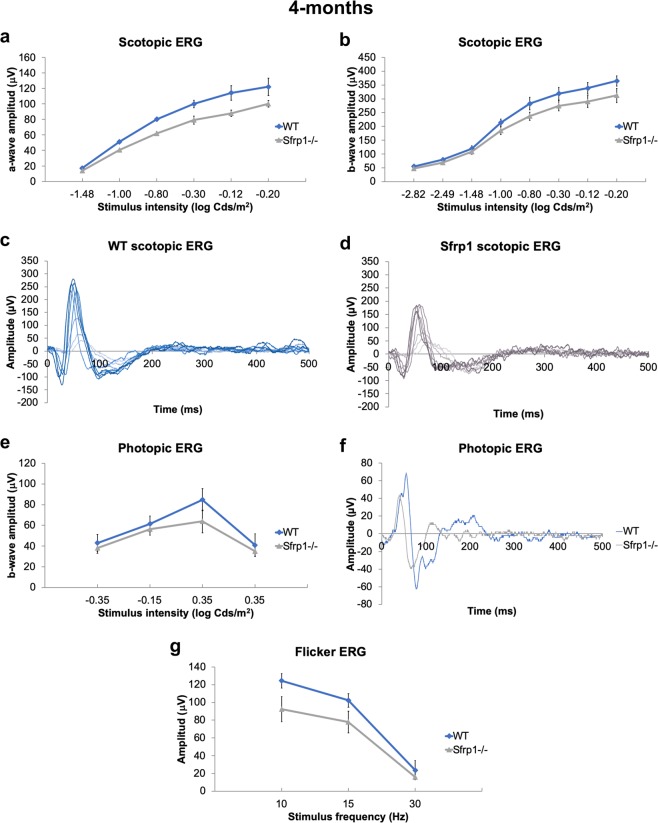
Figure 2.
Sfrp1−/− mice have a slightly reduced visual function. (a–d) The graphs and traces of representative recordings show the a- and b-wave amplitude (µV; defined in Fig. S2) of the scotopic ERG (rods, a–d) and the b-wave amplitude of photopic ERG (cones, e,f) from 4 months-old wt and Sfrp1−/− animals to flash light stimuli of increasing brightness (cd/m2). (e) The graph shows the amplitude response (µV) to flicker stimuli of increasing frequencies (Hz). No significant changes were detected (Mann-Whitney U test) but mutant mice show a reduced response.

