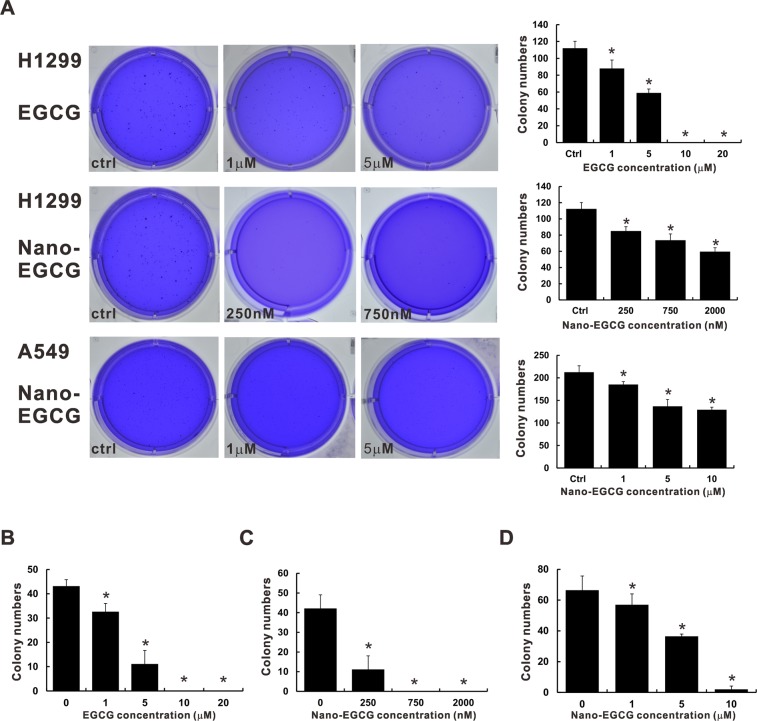
Figure 2.
Effects of EGCG and nano-EGCG on the colony formation activity in lung cancer cells. (A) Representative images of the anchorage-independent colony formation assay in H1299 and A549 cells. The graphs are the summarized data of the colony formation assays. Colonies >0.5 mm in diameter were counted and displayed in comparison with the control group. Anchorage-dependent colony formation assays of H1299 cells treated with EGCG (B) and nano-EGCG (C). (D) The effects of nano-EGCG on A549 cells anchorage-dependent colony formation abilities were also studied. Colonies >0.8 mm in diameter were counted and displayed in comparison with the control group. Values are reported as means ± SD (n ≥ 3). *P < 0.05 compared with the control group.

