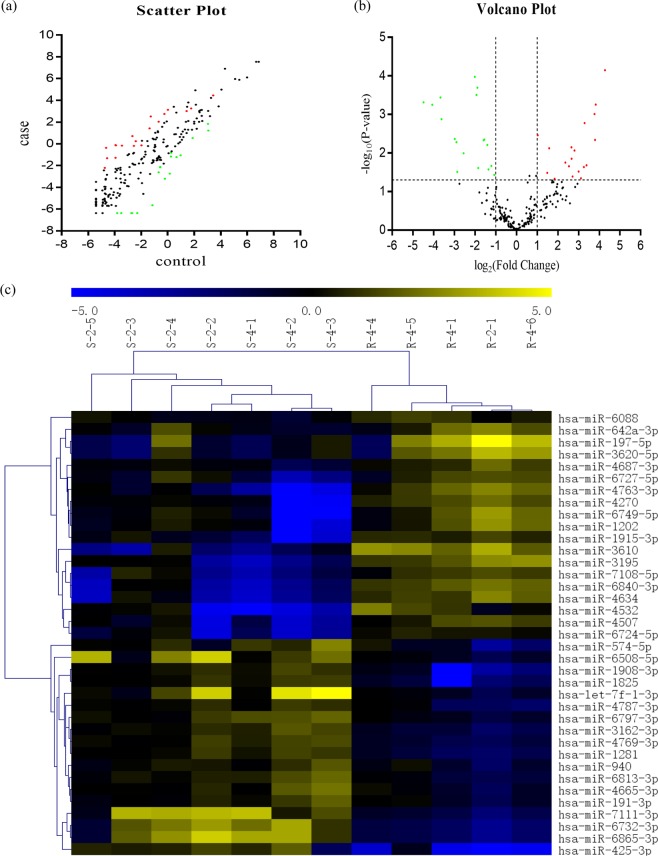
Figure 1.
Profiling of the microarray data: (a) Scatter plot is performed to visualize the expression variation of differentially expressed miRNAs between NPC with different radiosensitivity. The values of X and Y axis are log2 scaled intensity values of miRNA microarray probes. Red color implies miRNAs in higher expression level and green one signifies miRNAs in lower expression level. (b) Volcano plot is presented to show significantly differentially expressed miRNAs (P < 0.05). Fold change values are log2 transformed as the X axis while the log10 transformation of P values are set in the Y axis. (c) Hierarchical clustering is conducted to show the expression patterns of differentially expressed miRNAs in 12 samples.

