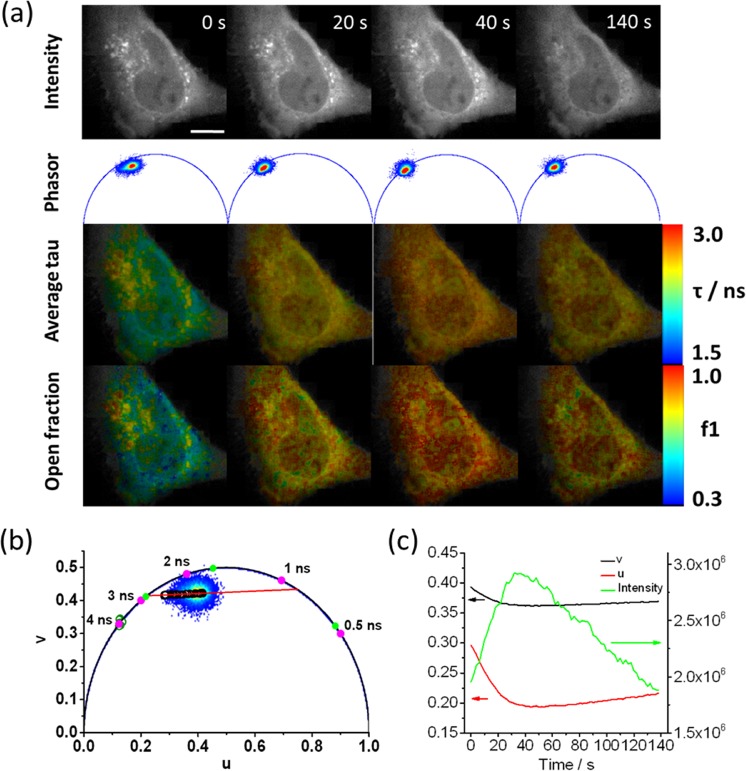
Figure 1.
Fluorescence lifetime imaging of HeLa cells expressing an mTurq2-Epac1-tddVenus biosensor. (a) Representative fluorescence intensity, corresponding phasor plots, average fluorescence lifetime FLIM images, and images of the fractional contribution of the open “activated” biosensor of a HeLa cell expressing mTurq2-Epac1-tddVenus biosensor at 4 time points following stimulation with forskolin (25 µM) and IBMX (100 µM). Images are 232 × 232 pixels with a field of view of 40 µm × 40 µm, an acquisition time of 2 s per frame and pixel binning of 7 × 7 pixels. (b) A representative phasor plot showing the cluster of data points prior to stimulation and the time-dependent position of the data cluster after stimulation (open black circles). The trajectory of the phasor as a function of time after stimulation can be well fitted to a straight line (solid red line). The phasor positions from control measurements from HeLa cells expressing empty vector mTurq2 (open green circles) lie on or very close to the universal circle. Three fluorescence lifetime contributions calculated from multi-image global fits to time-lapse imaging data (solid green circles) are shown along with reference calculated positions for several monoexponential fluorescence lifetimes (filled magenta circles). (c) Plots of u, v from the phasor plots, and total intensity values from the time-lapse measurements.

