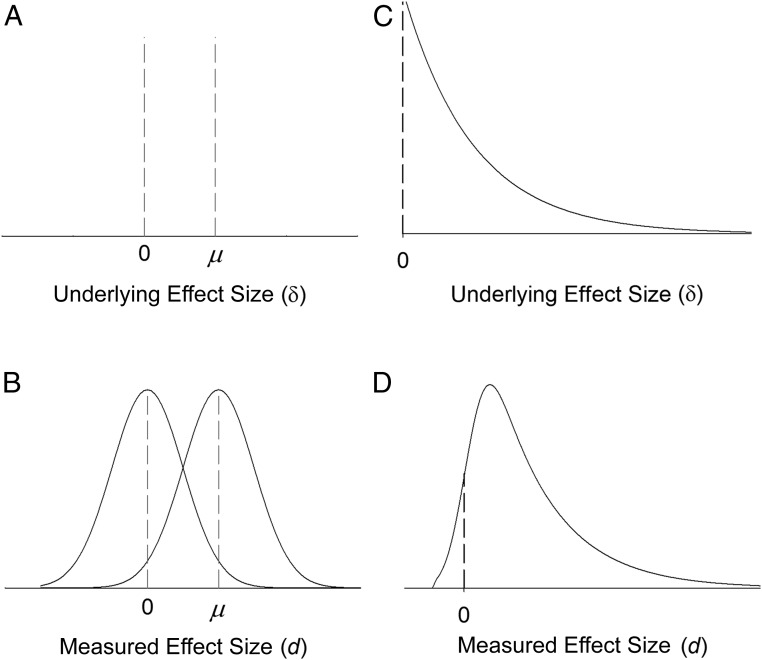
Fig. 2.
(A) The prior distribution of underlying effect sizes (δ) assumed by standard NHST logic. (B) The distribution of measured effect sizes (d) after adding Gaussian measurement error. (C) The prior distribution of δ according to the continuous view using the exponential distribution as an example. (D) If the prior distribution of δ is exponential, the distribution of d (which includes Gaussian measurement error) would be an ex-Gaussian.

